Travelers 2001 Annual Report Download - page 45
Download and view the complete annual report
Please find page 45 of the 2001 Travelers annual report below. You can navigate through the pages in the report by either clicking on the pages listed below, or by using the keyword search tool below to find specific information within the annual report.-
 1
1 -
2
-
3
-
4
-
5
-
6
-
7
-
8
-
9
-
10
-
11
-
12
-
13
-
14
-
15
-
16
-
17
-
18
-
19
-
20
-
21
-
22
-
23
-
24
-
25
-
26
-
27
-
28
-
29
-
30
-
31
-
32
-
33
-
34
-
 35
35 -
 36
36 -
 37
37 -
 38
38 -
 39
39 -
 40
40 -
 41
41 -
 42
42 -
 43
43 -
 44
44 -
 45
45 -
 46
46 -
 47
47 -
 48
48 -
 49
49 -
 50
50 -
 51
51 -
 52
52 -
 53
53 -
 54
54 -
 55
55 -
56
-
57
-
58
-
59
-
60
-
61
-
62
-
63
-
64
-
65
-
66
-
67
-
68
-
69
-
70
-
71
-
72
-
73
-
74
-
75
-
76
-
77
-
78
-
79
-
80
 |
 |

The St. Paul Companies 2001 Annual Report 43
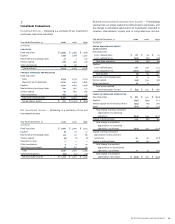
Consolidated Statements of Shareholders’ Equity
the st. paul companies
Year ended December 31 2001 2000 1999
(In millions)
preferred shareholders’ equity
SOP convertible preferred stock:
Beginning of year $117 $ 129 $ 134
Redemptions during the year (6) (12) (5)
End of year 111 117 129
Guaranteed obligation – SOP:
Beginning of year (68) (105) (119)
Principal payments 15 37 14
End of year (53) (68) (105)
Total Preferred Shareholders’ Equity 58 49 24
common shareholders’ equity
Common stock:
Beginning of year 2,238 2,079 2,128
Stock issued:
Stock incentive plans 67 95 37
Preferred shares redeemed 13 23 9
Conversion of company-obligated preferred securities —207 —
Reacquired common shares (135) (170) (102)
Other 947
End of year 2,192 2,238 2,079
Retained earnings:
Beginning of year 4,243 3,827 3,480
Net income (loss) (1,088) 993 834
Dividends declared on common stock (235) (232) (235)
Dividends declared on preferred stock, net of taxes (9) (8) (8)
Reacquired common shares (454) (366) (254)
Other changes 43 29 10
End of year 2,500 4,243 3,827
Unrealized appreciation on investments, net of taxes:
Beginning of year 765 568 1,027
Change for the year (323) 197 (459)
End of year 442 765 568
Unrealized loss on foreign currency translation, net of taxes:
Beginning of year (68) (26) (14)
Currency translation adjustments (8) (42) (12)
End of year (76) (68) (26)
Unrealized loss on derivatives, net of taxes:
Beginning of year ———
Change during the period (2) ——
End of year (2) ——
Total Common Shareholders’ Equity 5,056 7,178 6,448
Total Shareholders’ Equity $ 5,114 $ 7,227 $ 6,472
Consolidated Statements of Comprehensive Income
the st. paul companies
Year ended December 31 2001 2000 1999
(In millions)
Net income (loss) $ (1,088) $ 993 $ 834
Other comprehensive income (loss), net of taxes:
Change in unrealized appreciation on investments (323) 197 (459)
Change in unrealized loss on foreign currency translation (8) (42) (12)
Change in unrealized loss on derivatives (2) ——
Other comprehensive income (loss) (333) 155 (471)
Comprehensive income (loss) $ (1,421) $ 1,148 $ 363
See notes to consolidated financial statements.