Travelers 2001 Annual Report Download - page 38
Download and view the complete annual report
Please find page 38 of the 2001 Travelers annual report below. You can navigate through the pages in the report by either clicking on the pages listed below, or by using the keyword search tool below to find specific information within the annual report.-
 1
1 -
2
-
3
-
4
-
5
-
6
-
7
-
8
-
9
-
10
-
11
-
12
-
13
-
14
-
15
-
16
-
17
-
18
-
19
-
20
-
21
-
22
-
23
-
24
-
25
-
26
-
27
-
 28
28 -
 29
29 -
 30
30 -
 31
31 -
 32
32 -
 33
33 -
 34
34 -
 35
35 -
 36
36 -
 37
37 -
 38
38 -
 39
39 -
 40
40 -
 41
41 -
 42
42 -
 43
43 -
 44
44 -
 45
45 -
 46
46 -
 47
47 -
 48
48 -
49
-
50
-
51
-
52
-
53
-
54
-
55
-
56
-
57
-
58
-
59
-
60
-
61
-
62
-
63
-
64
-
65
-
66
-
67
-
68
-
69
-
70
-
71
-
72
-
73
-
74
-
75
-
76
-
77
-
78
-
79
-
80
 |
 |

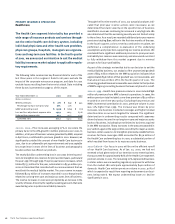
In May 2000, we completed the sale of our nonstandard auto
operations for a total cash consideration of approximately $175
million (net of a $25 million dividend paid by these operations to
our property-liability operations prior to closing). In September
1999, we completed the sale of our standard personal insurance
operations to Metropolitan for net proceeds of approximately $272
million. Proceeds from both transactions were used for general
corporate purposes.
Capital Commitments – Capital expenditures that we might consider
in 2002 include acquisitions of existing businesses consistent with
our commercial insurance focus, and repurchases of our common
stock. As of year-end 2001 and through Jan. 23, 2002, we had the
authorization to make up to $89 million of common share repur-
chases under a repurchase program approved by our board of
directors in February 2001. We repurchase our shares on the open
market and through private transactions when we deem such repur-
chases to be a prudent use of capital. We made no major capital
improvements during any of the last three years.
the st. paul companies
Liquidity
Liquidity is a measure of our ability to generate sufficient cash flows
to meet the short- and long-term cash requirements of our business
operations. Our underwriting operations’ short-term cash needs pri-
marily consist of paying insurance loss and loss adjustment
expenses and day-to-day operating expenses. Those needs are met
through cash receipts from operations, which consist primarily of
insurance premiums collected and investment income. Our invest-
ment portfolio is also a source of additional liquidity, through the
sale of readily marketable fixed maturities, equity securities and
short-term investments, as well as longer-term investments such
as real estate and venture capital holdings. After satisfying our cash
requirements, excess cash flows from these underwriting and
investment activities are used to build the investment portfolio and
thereby increase future investment income.
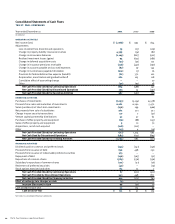
Cash flows from continuing operations totaled $884 million in 2001,
compared with cash outflows of $588 million in 2000 and cash
flows of $147 million in 1999. The strong improvement in 2001 was
the result of several factors. In our property-liability operations,
written premiums of $7.76 billion were 32% higher than in 2000,
significantly outpacing the 9% increase in insurance losses and loss
adjustment expenses paid. Our net paid losses and loss adjustment
expenses totaled $5.57 billion in 2001. Premium payments we made
related to our corporate reinsurance program in 2001 totaled $165
million, down significantly from payments of $345 million in 2000.
In addition, we received net federal tax refunds of $54 million in
2001, compared with net federal tax payments of $161 million in
2000. Our asset management segment also contributed approxi-
mately $82 million to the improvement in consolidated operational
cash flows in 2001.
The deterioration in 2000 operational cash flows compared with
1999 was primarily due to significant loss payments in our
Reinsurance, Health Care and Lloyd’s and Other business segments,
and premium payments totaling $345 million related to our corpo-
rate reinsurance program. Our underwriting cash flows in 1999 were
negatively impacted by the reductions in written premium volume
and investment receipts in our property-liability operations. Also in
1999, we made premium payments totaling $129 million related to
our corporate reinsurance program. The sale of fixed-maturity
investments to fund operational cash flow requirements resulted in
lower levels of investment cash flows in each of the last three years.
We expect our operational cash flows will be negatively impacted
in 2002 by the magnitude of insurance losses and loss adjustment
expenses payable as a result of the Sept. 11 terrorist attack, as well
as losses payable related to businesses we are exiting, particularly
the medical liability business. Excluding those factors, however, we
expect further improvement in operational cash flows in 2002,
reflecting the benefit of corrective pricing and underwriting actions
in our property-liability operations and expense reduction initia-
tives implemented throughout our operations in recent years. We
believe our financial position is strong and debt level conservative,
which provide us with the flexibility and capacity to obtain funds
externally through debt or equity financings on both a short-term
and long-term basis.
We do not anticipate receiving any cash dividends from our insur-
ance underwriting subsidiaries in 2002. We have sufficient
resources available at the parent company to fund common and
preferred shareholder dividends, interest payments and distribu-
tions on debt and preferred securities, respectively, and other
administrative expenses.
We are not aware of any current recommendations by regulatory
authorities that, if implemented, might have a material impact on
our liquidity, capital resources or operations.
the st. paul companies
Exposures to Market Risk
Market risk can be described as the risk of change in fair value of a
financial instrument due to changes in interest rates, equity prices,
creditworthiness, foreign exchange rates or other factors. We seek
to mitigate that risk by a number of actions, as described below.
Our exposure to these risks, and our policies to address these risks,
were unchanged from the previous year.
Interest Rate Risk – Our exposure to market risk for changes in inter-
est rates is concentrated in our investment portfolio, and to a lesser
extent, our debt obligations. However, changes in investment values
attributable to interest rate changes are mitigated by correspon-
ding and partially offsetting changes in the economic value of our
insurance reserves and debt obligations. We monitor this exposure
through periodic reviews of our asset and liability positions. Our
estimates of cash flows, as well as the impact of interest rate fluc-
tuations relating to our investment portfolio and insurance reserves,
are modeled and reviewed quarterly.
The following table provides principal cash flow estimates by year
for our Dec. 31, 2001 and 2000 inventories of interest-sensitive
investment assets considered to be other than trading. Also pro-
vided are the weighted average interest rates associated with each
year’s cash flows. Principal cash flow projections for collateralized
mortgage obligations were prepared using third-party prepayment
analyses. Cash flow estimates for mortgage passthroughs were pre-
pared using average prepayment rates for the prior three months.
Principal cash flow estimates for callable bonds are either to
The St. Paul Companies 2001 Annual Report36