Travelers 2001 Annual Report Download - page 66
Download and view the complete annual report
Please find page 66 of the 2001 Travelers annual report below. You can navigate through the pages in the report by either clicking on the pages listed below, or by using the keyword search tool below to find specific information within the annual report.-
 1
1 -
2
-
3
-
4
-
5
-
6
-
7
-
8
-
9
-
10
-
11
-
12
-
13
-
14
-
15
-
16
-
17
-
18
-
19
-
20
-
21
-
22
-
23
-
24
-
25
-
26
-
27
-
28
-
29
-
30
-
31
-
32
-
33
-
34
-
35
-
36
-
37
-
38
-
39
-
40
-
41
-
42
-
43
-
44
-
45
-
46
-
47
-
48
-
49
-
50
-
51
-
52
-
53
-
54
-
55
-
 56
56 -
 57
57 -
 58
58 -
 59
59 -
 60
60 -
 61
61 -
 62
62 -
 63
63 -
 64
64 -
 65
65 -
 66
66 -
 67
67 -
 68
68 -
 69
69 -
 70
70 -
 71
71 -
 72
72 -
 73
73 -
 74
74 -
 75
75 -
 76
76 -
77
-
78
-
79
-
80
 |
 |

The St. Paul Companies 2001 Annual Report64
14
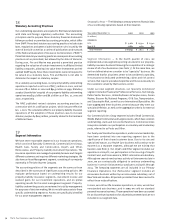
Discontinued Operations
Life Insurance — On September 28, 2001, our subsidiary, St. Paul
Fire and Marine Insurance Company (“Fire and Marine”), closed on
the sale of its life insurance subsidiary, Fidelity and Guaranty Life
Insurance Company (“F&G Life”) to Old Mutual plc (“Old Mutual”)
for $335 million in cash and $300 million in shares of Old Mutual
stock. In accordance with the sale agreement, the sale proceeds
were reduced by $11.7 million, on a pretax basis, related to a
decrease in the market value of certain securities within F&G Life’s
investment portfolio between March 31, 2001 and the closing date.
Pursuant to the sale agreement, we are required to hold the Old Mutual
stock received for one year after the closing of the transaction. The
consideration received is subject to possible additional adjustment
based on the market price of Old Mutual’s stock at the end of that
one-year period, as described in greater detail in Note 15.
When the sale was announced in April 2001, we expected to realize
a modest gain on the sale of F&G Life, when proceeds were
combined with F&G Life’s operating results through the disposal
date. However, a decline in the market value of certain of F&G Life’s
investments subsequent to April, coupled with a change in the
anticipated tax treatment of the sale, resulted in an after-tax loss of
$73 million on the sale proceeds. That loss is combined with
F&G Life’s results of operations for a year-to-date after-tax loss of
$54 million and is included in the reported loss from discontinued
operations for the year ended Dec. 31, 2001.
Also in September 2001, we sold American Continental Life
Insurance Company, a small life insurance company we had acquired
as part of our MMI purchase, to CNA Financial Corporation. We
received cash proceeds of $21 million, and recorded a net after-tax
loss on the sale of $1 million.
Standard Personal Insurance Business — In June 1999, we made a
decision to sell our standard personal insurance business and, on
July 12, 1999, reached an agreement to sell this business to
Metropolitan Property and Casualty Insurance Company
(“Metropolitan”). On Sept. 30, 1999, we completed the sale of
this business to Metropolitan. As a result, the standard personal
insurance operations through June 1999 have been accounted for
as discontinued operations for all periods presented herein, and
the results of operations subsequent to that period have been
included in the gain on sale of discontinued operations.
Metropolitan purchased Economy Fire & Casualty Company and its
subsidiaries (“Economy”), as well as the rights and interests in those
non-Economy policies constituting our remaining standard personal
insurance operations. Those rights and interests were transferred
to Metropolitan by way of a reinsurance and facility agreement
(“Reinsurance Agreement”).
The Reinsurance Agreement relates solely to the non-Economy
standard personal insurance policies, and was entered into solely
as a means of accommodating Metropolitan through a transition
period. The Reinsurance Agreement allows Metropolitan to write
non-Economy business on our policy forms while Metropolitan
obtains the regulatory license, form and rate approvals necessary
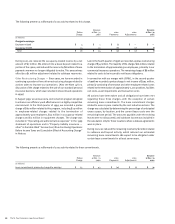
The weighted average fair value of options granted during 1999 was
$2.66 per option. The fair value of the variable options was
estimated on the date of grant using a variable option-pricing model
with the following weighted average assumptions: dividend yield
of 2.8%; expected volatility of 22.9%; risk-free interest rate of 4.7%;
and an expected life of 2.8 years.
restricted stock and deferred stock awards
Up to 20% of the 33.4 million shares authorized under our 1994
stock incentive plan may be granted as restricted stock awards. The
stock for this type of award is restricted because recipients receive
the stock only upon completing a specified objective or period of
employment, generally one to five years. The shares are considered
issued when awarded, but the recipient does not own and cannot
sell the shares during the restriction period. During the restriction
period, the recipient receives compensation in an amount equivalent
to the dividends paid on such shares. Up to 5,600,000 shares were
available for restricted stock awards at Dec. 31, 2001.
We also have a Deferred Stock Award Plan for stock awards to non-
U.S. employees. Deferred stock awards are the same as restricted
stock awards, except that shares granted under the deferred plan
are not issued until the vesting conditions specified in the award
are fulfilled. Up to 21,000 shares were available for deferred stock
awards at Dec. 31, 2001.
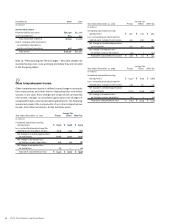
pro forma information
Had we calculated compensation expense on a combined basis for
our stock option grants based on the “fair value” method described
in SFAS No. 123, our net income and earnings per share would have
been reduced to the pro forma amounts as indicated.
Year ended December 31 2001 2000 1999
(In millions, except per share data)
net income
As reported $(1,088) $ 993 $ 834
Pro forma (1,123) 986 825
basic earnings per share
As reported (5.22) 4.50 3.61
Pro forma (5.44) 4.46 3.57
diluted earnings per share
As reported (5.22) 4.24 3.41
Pro forma (5.44) 4.23 3.38