Travelers 2001 Annual Report Download - page 22
Download and view the complete annual report
Please find page 22 of the 2001 Travelers annual report below. You can navigate through the pages in the report by either clicking on the pages listed below, or by using the keyword search tool below to find specific information within the annual report.-
 1
1 -
2
-
3
-
4
-
5
-
6
-
7
-
8
-
9
-
10
-
11
-
 12
12 -
 13
13 -
 14
14 -
 15
15 -
 16
16 -
 17
17 -
 18
18 -
 19
19 -
 20
20 -
 21
21 -
 22
22 -
 23
23 -
 24
24 -
 25
25 -
 26
26 -
 27
27 -
 28
28 -
 29
29 -
 30
30 -
 31
31 -
 32
32 -
33
-
34
-
35
-
36
-
37
-
38
-
39
-
40
-
41
-
42
-
43
-
44
-
45
-
46
-
47
-
48
-
49
-
50
-
51
-
52
-
53
-
54
-
55
-
56
-
57
-
58
-
59
-
60
-
61
-
62
-
63
-
64
-
65
-
66
-
67
-
68
-
69
-
70
-
71
-
72
-
73
-
74
-
75
-
76
-
77
-
78
-
79
-
80
 |
 |

Catastrophe losses totaled $1.27 billion in 2001, of which $1.11 billion
was due to the Sept. 11 terrorist attack. Most of the other $160 mil-
lion of catastrophe losses were the result of a variety of storms
throughout the year in the U.S. and the explosion of a chemical
manufacturing plant in Toulouse, France. In 2000 and 1999, catas-
trophe losses totaled $165 million and $257 million, respectively.
Additional loss development arising from severe windstorms that
struck portions of Europe in late 1999 and severe flooding in the
United Kingdom drove the 2000 total. Major events contributing to
the 1999 total included Hurricane Floyd, earthquakes in Taiwan and
Turkey, and European windstorms.
The prior-year reserve provisions in the Health Care segment of
$735 million in 2001 and $225 million in 2000 were prompted by
the continuing escalation of jury awards in professional liability law-
suits against our policyholders. The decline in the impact of the
reinsurance treaties in 2001 compared with the preceding two years
was due to our decision not to cede losses under the 2001 corpo-
rate treaty, as discussed on page 19 of this report.
The 6.8-point deterioration in the 2001 adjusted loss ratio compared
with 2000 primarily resulted from prior-year reserve strengthening
in our Surety and Construction segment in response to current eco-
nomic conditions, and a reduction in favorable prior-year loss
development in our Commercial Lines Group segment. In 2000, the
2.9-point improvement in the adjusted loss ratio over 1999 was pri-
marily due to the impact of price increases and corrective
underwriting initiatives in our Commercial Lines Group segment.
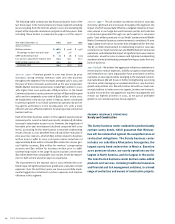
Expense Ratio – The expense ratio measures underwriting expenses
as a percentage of premiums written. The following table summarizes
major factors impacting our reported expense ratio in each of the
last three years. The adjusted expense ratio excludes the effect of
those factors and is shown to provide a clearer understanding of our
underlying performance.
Year ended December 31 2001 2000 1999
Reported expense ratio 28.1 34.8 35.0
Adjustments:
Terrorist attack 1.5 ––
Excess-of-loss reinsurance treaties (0.5) (2.6) (1.7)
Adjusted expense ratio 29.1 32.2 33.3
The 1.5-point adjustment related to the terrorist attack in our
reported expense ratio represented the impact of reducing contin-
gent commission expense by $91 million in our Reinsurance
segment. The commissions, which were payable contingent on the
loss experience on the reinsurance treaties to which they related,
had been accrued prior to Sept. 11; however, the magnitude of our
reinsurance losses from the terrorist attack resulted in the reversal
of that expense accrual.
No underwriting expenses were ceded under the reinsurance
treaties; however, our reported expense ratios in all three years
included effects of written premiums ceded under the reinsurance
treaties. The improvement in our adjusted expense ratios in both
2001 and 2000 reflected the combined effect of significant premium
growth in both years, as well as efficiencies realized throughout our
underwriting operations as a result of our expense reduction ini-
tiatives over the last three years.
Expense reduction efforts included those related to the integration
of USF&G Corporation and The St. Paul subsequent to the merger
of the two organizations in 1998; the restructuring of our
Commercial Lines Group and Specialty Commercial segments later
in 1998; and our 1999 cost reduction program. These efforts
involved the consolidation of field office locations, the streamlin-
ing of our claim organization, and the combined elimination of
approximately 3,300 employee positions in total, the majority of
which were in our underwriting operations.
underwriting operations’ outlook for 2002
We expect significant improvement in our underwriting results in
2002, due to continuing price increases and our renewed focus on
opportunities emerging in the U.S. commercial insurance market-
place. We are making progress on the profit improvement strategies
we announced at the end of 2001, and the business centers that
form the foundation of our future are performing well. We are
increasing our investment in our small commercial insurance line of
business and other standard commercial lines of business that offer
superior opportunities for profit. We believe our broad underwrit-
ing expertise, strong financial ratings and solid agent relationships
will enable us to reap the benefits of a hardening commercial insur-
ance market. Further, an increase in customer appreciation for risk
management products and services is expanding opportunities for
us to capitalize on our strengths in the marketplace.
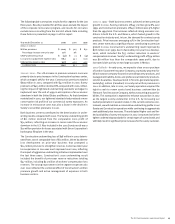
underwriting results by segment
The following table summarizes written premiums, underwriting
results, combined ratios and adjusted combined ratios (as
described in footnote to table) for each of our property-liability
underwriting business segments for the last three years. All data
for 2000 and 1999 were reclassified to conform to our new segment
reporting format implemented in 2001. Following the table are
detailed analyses of our 2001 results and a look ahead to 2002 for
each segment.
The St. Paul Companies 2001 Annual Report20