Travelers 2001 Annual Report Download - page 26
Download and view the complete annual report
Please find page 26 of the 2001 Travelers annual report below. You can navigate through the pages in the report by either clicking on the pages listed below, or by using the keyword search tool below to find specific information within the annual report.-
 1
1 -
2
-
3
-
4
-
5
-
6
-
7
-
8
-
9
-
10
-
11
-
12
-
13
-
14
-
15
-
 16
16 -
 17
17 -
 18
18 -
 19
19 -
 20
20 -
 21
21 -
 22
22 -
 23
23 -
 24
24 -
 25
25 -
 26
26 -
 27
27 -
 28
28 -
 29
29 -
 30
30 -
 31
31 -
 32
32 -
 33
33 -
 34
34 -
 35
35 -
 36
36 -
37
-
38
-
39
-
40
-
41
-
42
-
43
-
44
-
45
-
46
-
47
-
48
-
49
-
50
-
51
-
52
-
53
-
54
-
55
-
56
-
57
-
58
-
59
-
60
-
61
-
62
-
63
-
64
-
65
-
66
-
67
-
68
-
69
-
70
-
71
-
72
-
73
-
74
-
75
-
76
-
77
-
78
-
79
-
80
 |
 |

The St. Paul Companies 2001 Annual Report24
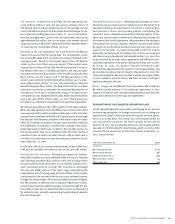
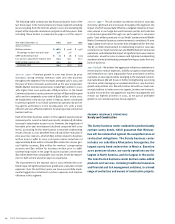
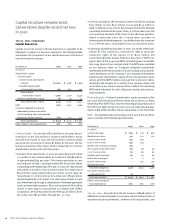
The following table summarizes key financial data for each of the
last three years in the Commercial Lines Group segment excluding
losses resulting from the terrorist attack in 2001 and excluding the
impact of the corporate reinsurance program in all three years. Data
including these factors is presented on page 21 of this report.
Year ended December 31 2001 2000 1999
(Dollars in millions)
Written premiums $ 1,687 $ 1,418 $ 1,358
Percentage increase over prior year 19% 4%
GAAP underwriting result $71$ 98 $ (234)
Loss and loss adjustment expense ratio 64.0 58.7 80.2
Underwriting expense ratio 30.2 34.2 35.7
Combined ratio 94.2 92.9 115.9
2001 vs. 2000 – Premium growth in 2001 was driven by price
increases, strong renewal retention rates and new business
throughout the segment. Price increases averaged 14% in 2001, and
the pace of those increases accelerated as the year progressed.
Middle Market Commercial premiums totaled $971 million in 2001,
16% higher than 2000 premiums of $836 million. In the Small
Commercial business center, premium volume of $579 million grew
19% over the comparable 2000 total of $485 million. In July 2001,
we established a new service center in Atlanta, which contributed
to premium growth in our Small Commercial operation by provid-
ing agents and brokers in the southeastern U.S. with a more
efficient and cost-effective platform for placing small commercial
business with us.
Each of the three business centers in this segment experienced an
improvement in current accident year results, despite a $38 million
increase in catastrophe losses in 2001. However, the magnitude of
favorable prior-year development declined compared with 2000
levels, accounting for the deterioration in reported underwriting
results. Results in 2001 benefited from a $128 million reduction in
prior-year loss reserves, of which $93 million related to business
written prior to 1988. In 2000, prior-year reserve reductions of
approximately $260 million included $80 million for various gen-
eral liability reserves, $69 million for workers’ compensation
reserves and $50 million for business written prior to 1988.
Underwriting results in the Large Accounts business center were
$31 million better than comparable 2000 results, driven by improve-
ment in both current and prior-year loss experience.
The improvement in the expense ratio in 2001 reflected the com-
bined impact of significant premium growth and a reduction in fixed
expenses. Over the last three years, we have successfully imple-
mented aggressive initiatives to reduce expenses and improve
efficiency in this segment.
2000 vs. 1999 — The 4% increase in premium volume in 2000 was
driven by significant price increases throughout the segment, the
impact of which was partially offset by a targeted reduction in busi-
ness volume in our Large Accounts business center, and a decline
in premiums generated through our participation in insurance
pools. Total written premiums in our Small Commercial and Middle
Market Commercial business centers increased a combined 7% over
1999, largely due to price increases that averaged 9% for the year.
The $332 million improvement in underwriting results in 2000 was
centered in our Small Commercial and Middle Market Commercial
operations, and reflected the impact of significant prior-year reserve
reductions, as well as price increases and tightened underwriting
standards aimed at eliminating underperforming accounts from our
book of business.
2002 Outlook – We believe the aggressive initiatives undertaken in
recent years to reduce expenses, solidify our agency relationships
and streamline our claim organization have positioned us well to
capitalize on new opportunities emerging in the standard commer-
cial marketplace. We will focus on further strengthening our pricing
structure, while managing our renewal retentions, new business
growth and portfolio mix. We will continue to build our small com-
mercial platform to better serve our agents, brokers and insureds.
Quality risk selection and aggressive expense management will
remain our highest priorities in 2002, as we pursue profitable
growth in our Commercial Lines Group segment.
primary insurance operations
Surety and Construction
The Surety business center underwrites predominantly
contract surety bonds, which guarantee that third par-
ties will be indemnified against the nonperformance of
contractual obligations. The Surety business center
includes our subsidiary Afianzadora Insurgentes, the
largest surety bond underwriter in Mexico. Based on
2000 premium volume, our surety operations are the
largest in North America, and the largest in the world.
The Construction business center delivers value-added
products and services, including traditional insurance
and financial and risk management solutions, to a broad
range of contractors and owners of construction projects.