Travelers 2001 Annual Report Download - page 44
Download and view the complete annual report
Please find page 44 of the 2001 Travelers annual report below. You can navigate through the pages in the report by either clicking on the pages listed below, or by using the keyword search tool below to find specific information within the annual report.-
 1
1 -
2
-
3
-
4
-
5
-
6
-
7
-
8
-
9
-
10
-
11
-
12
-
13
-
14
-
15
-
16
-
17
-
18
-
19
-
20
-
21
-
22
-
23
-
24
-
25
-
26
-
27
-
28
-
29
-
30
-
31
-
32
-
33
-
 34
34 -
 35
35 -
 36
36 -
 37
37 -
 38
38 -
 39
39 -
 40
40 -
 41
41 -
 42
42 -
 43
43 -
 44
44 -
 45
45 -
 46
46 -
 47
47 -
 48
48 -
 49
49 -
 50
50 -
 51
51 -
 52
52 -
 53
53 -
 54
54 -
55
-
56
-
57
-
58
-
59
-
60
-
61
-
62
-
63
-
64
-
65
-
66
-
67
-
68
-
69
-
70
-
71
-
72
-
73
-
74
-
75
-
76
-
77
-
78
-
79
-
80
 |
 |

The St. Paul Companies 2001 Annual Report42
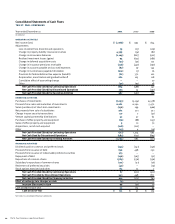
Consolidated Balance Sheets
the st. paul companies
December 31 2001 2000
(In millions)
assets
Investments:
Fixed maturities $ 15,911 $ 14,730
Equities 1,410 1,466
Real estate and mortgage loans 972 1,025
Venture capital 859 1,064
Securities on loan 775 1,207
Short-term investments 2,153 2,331
Other investments 98 229
Total investments 22,178 22,052
Cash 151 52
Reinsurance recoverables:
Unpaid losses 6,848 4,651
Paid losses 351 324
Ceded unearned premiums 667 814
Receivables:
Underwriting premiums 3,123 2,937
Interest and dividends 260 277
Other 247 181
Deferred policy acquisition costs 628 576
Deferred income taxes 1,248 930
Office properties and equipment 486 492
Goodwill and intangible assets 690 510
Other assets 1,444 1,706
Total Assets $ 38,321 $ 35,502
liabilities
Insurance reserves:
Losses and loss adjustment expenses $ 22,101 $ 18,196
Unearned premiums 3,957 3,648
Total insurance reserves 26,058 21,844
Debt 2,130 1,647
Payables:
Reinsurance premiums 943 1,060
Income taxes —170
Accrued expenses and other 1,036 1,031
Securities lending collateral 790 1,231
Other liabilities 1,357 955
Total Liabilities 32,314 27,938
Company-obligated mandatorily redeemable preferred securities of trusts holding
solely subordinated debentures of the company 893 337
shareholders’ equity
Preferred:
SOP convertible preferred stock 111 117
Guaranteed obligation – SOP (53) (68)
Total Preferred Shareholders’ Equity 58 49
Common:
Common stock 2,192 2,238
Retained earnings 2,500 4,243
Accumulated other comprehensive income, net of taxes:
Unrealized appreciation on investments 442 765
Unrealized loss on foreign currency translation (76) (68)
Unrealized loss on derivatives (2) —
Total accumulated other comprehensive income 364 697
Total Common Shareholders’ Equity 5,056 7,178
Total Shareholders’ Equity 5,114 7,227
Total Liabilities, Redeemable Preferred Securities and Shareholders’ Equity $ 38,321 $ 35,502
See notes to consolidated financial statements.