Travelers 2001 Annual Report Download - page 19
Download and view the complete annual report
Please find page 19 of the 2001 Travelers annual report below. You can navigate through the pages in the report by either clicking on the pages listed below, or by using the keyword search tool below to find specific information within the annual report.-
 1
1 -
2
-
3
-
4
-
5
-
6
-
7
-
8
-
 9
9 -
 10
10 -
 11
11 -
 12
12 -
 13
13 -
 14
14 -
 15
15 -
 16
16 -
 17
17 -
 18
18 -
 19
19 -
 20
20 -
 21
21 -
 22
22 -
 23
23 -
 24
24 -
 25
25 -
 26
26 -
 27
27 -
 28
28 -
 29
29 -
30
-
31
-
32
-
33
-
34
-
35
-
36
-
37
-
38
-
39
-
40
-
41
-
42
-
43
-
44
-
45
-
46
-
47
-
48
-
49
-
50
-
51
-
52
-
53
-
54
-
55
-
56
-
57
-
58
-
59
-
60
-
61
-
62
-
63
-
64
-
65
-
66
-
67
-
68
-
69
-
70
-
71
-
72
-
73
-
74
-
75
-
76
-
77
-
78
-
79
-
80
 |
 |

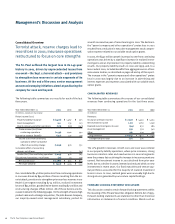
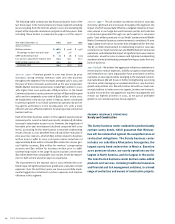
The Health Care segment, placed in runoff at the end of 2001,
remains a separate reportable segment. All data for 2000 and 1999
included in this report was restated to be consistent with the new
reporting structure in 2001.
enron corporation bankruptcy
In December 2001, we announced that our aggregate limits of net
insurance exposure related to Enron Corporation’s bankruptcy was
approximately $83 million on an after-tax basis ($128 million on a
pretax basis). Our net exposure is spread throughout our property-
liability underwriting segments, but is concentrated in coverages
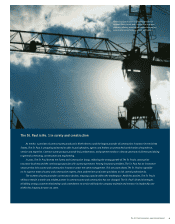
for gas supply bonds in our Surety and Construction segment. We
believe that our actual losses will be substantially less than our
total exposure. Our underwriting results in 2001 included pretax
incurred losses of $22 million related to the Enron bankruptcy. That
amount included no provision for losses on the gas supply bonds.
In addition, we hold in our investment portfolio Enron Corporate
Senior Unsecured Debt with a par value of $23 million. Subsequent
to Enron’s declaration of bankruptcy, we recorded a $19 million
write-down in the carrying value of these investments, which was
recorded as a realized investment loss.
adoption of sfas no. 133
On Jan. 1, 2001, we adopted the provisions of Statement of Financial
Accounting Standards (SFAS) No. 133, “Accounting for Derivative
Instruments and Hedging Activities,” as amended by SFAS Nos. 137
and 138. Provisions of SFAS No. 133 require the recognition of
derivatives as either assets or liabilities on the balance sheet and
the measurement of those instruments at fair value. We have
limited involvement with derivative instruments, primarily for pur-
poses of hedging against fluctuations in foreign currency exchange
rates and interest rates. We also have entered into a variety of other
financial instruments considered to be derivatives, but which are
not designated as hedges, that we utilize to minimize the potential
impact of market movements in certain investment portfolios. Our
adoption of SFAS No. 133, as amended, did not have a material
impact on our financial position or results of continuing operations.
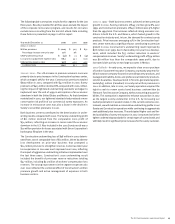
cumulative effect of accounting change
Our net income in 1999 included a pretax expense in continuing
operations of $41 million ($27 million after-tax), representing the
cumulative effect of adopting the AICPA’s Statement of Position
(“SOP”) 97-3, “Accounting by Insurance and Other Enterprises for
Insurance-Related Assessments.” The SOP provides guidance for
recognizing and measuring liabilities for guaranty and other insur-
ance-related assessments. In the third quarter of 1999, the State of
New York enacted a law that changed its assessment method from
a loss-based method to a written premium-based method. As a
result, we reduced our previously recorded pretax accrual by
$12 million, which was recorded in income from continuing opera-
tions in 1999. The accrual is expected to be disbursed as assessed
during a period of up to 30 years.
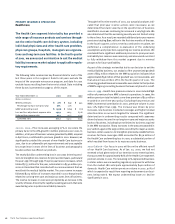
critical accounting policies
Overview – The St. Paul Companies, Inc. is a holding company with
subsidiaries operating in the property-liability insurance industry
and the asset management industry. We combine our financial
statements with those of our subsidiaries and present them on a
consolidated basis in accordance with U.S. generally accepted
accounting principles.
We make estimates and assumptions that can have a significant
effect on the amounts that we report in our financial statements.
The most significant estimates relate to our reserves for property-
liability insurance losses and loss adjustment expenses. We
continually review and analyze our estimates, but actual results
may turn out to be significantly different than we expected when
the estimates were made.
In our investment portfolio, we monitor the difference between our
cost and the estimated fair value of investments. If any of these
investments experience a decline in value that we believe is other
than temporary, we write down the investment for the decline and
record a realized loss on our statement of operations.
Property-Liability Operations – Premiums on insurance policies we
sell are our largest source of revenue, and we recognize the premi-
ums as revenue evenly over the term of the policy. Our insurance
reserves are our largest liability, and reflect our estimate of claims
reported but not yet paid, and claims incurred but not yet reported
to us. The costs related to writing a policy are amortized over the
same period the related premiums are recognized as revenue.
Reinsurance accounting is followed when risk transfer requirements
have been met. These requirements involve significant assumptions
being made related to the amount and timing of expected cash
flows, as well as the interpretation of the underlying contract terms.
Asset Management Operations – We are the 77% owner of The John
Nuveen Company, which comprises our asset management seg-
ment. We consolidate 100% of Nuveen’s revenues, expenses, assets
and liabilities, with reductions on the statement of operations and
balance sheet for minority shareholders’ proportionate interest in
Nuveen’s earnings and equity.
In the following pages we provide a detailed discussion of 2001
results produced by our six business segments that underwrite
property-liability insurance and provide related services for partic-
ular market sectors. We also review the performance of our
property-liability underwriting operations’ investment segment.
After the property-liability discussion, we discuss the results of our
asset management segment.
In the property-liability underwriting discussions, we sometimes
use the term “prior-year loss development,” (or similar terms) which
refers to an increase or decrease in losses recorded in the current
calendar year which relate to business underwritten in prior years.
Similarly, we sometimes refer to “current-year loss development”
or “current accident year loss activity,” which refer to losses
recorded on business written in the current year.
The St. Paul Companies 2001 Annual Report 17