Travelers 2001 Annual Report Download - page 55
Download and view the complete annual report
Please find page 55 of the 2001 Travelers annual report below. You can navigate through the pages in the report by either clicking on the pages listed below, or by using the keyword search tool below to find specific information within the annual report.-
 1
1 -
2
-
3
-
4
-
5
-
6
-
7
-
8
-
9
-
10
-
11
-
12
-
13
-
14
-
15
-
16
-
17
-
18
-
19
-
20
-
21
-
22
-
23
-
24
-
25
-
26
-
27
-
28
-
29
-
30
-
31
-
32
-
33
-
34
-
35
-
36
-
37
-
38
-
39
-
40
-
41
-
42
-
43
-
44
-
 45
45 -
 46
46 -
 47
47 -
 48
48 -
 49
49 -
 50
50 -
 51
51 -
 52
52 -
 53
53 -
 54
54 -
 55
55 -
 56
56 -
 57
57 -
 58
58 -
 59
59 -
 60
60 -
 61
61 -
 62
62 -
 63
63 -
 64
64 -
 65
65 -
66
-
67
-
68
-
69
-
70
-
71
-
72
-
73
-
74
-
75
-
76
-
77
-
78
-
79
-
80
 |
 |

The St. Paul Companies 2001 Annual Report 53
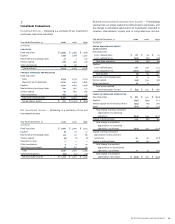
7
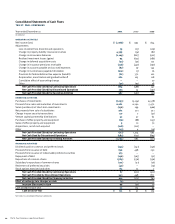
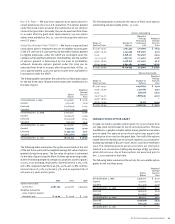
Investment Transactions
Investment Activity — Following is a summary of our investment
purchases, sales and maturities.
Year ended December 31 2001 2000 1999
(In millions)
purchases
Fixed maturities $4,959 $ 2,489 $ 2,818
Equities 1,737 2,168 1,403
Real estate and mortgage loans 27 3130
Venture capital 287 446 218
Other investments 23 48 9
Total purchases 7,033 5,154 4,578
proceeds from sales and maturities
Fixed maturities:
Sales 2,035 1,739 1,726
Maturities and redemptions 2,200 1,406 1,858
Equities 1,732 2,183 1,438
Real estate and mortgage loans 100 265 133
Venture capital 50 663 283
Other investments 164 34 34
Total sales and maturities 6,281 6,290 5,472
Net purchases (sales) $752 $ (1,136) $ (894)
Net Investment Income — Following is a summary of our net
investment income.
Year ended December 31 2001 2000 1999
(In millions)
Fixed maturities $ 1,069 $ 1,090 $ 1,104
Equities 16 16 17
Real estate and mortgage loans 115 91 86
Venture capital (4) (1) (1)
Securities on loan 222
Other investments 3410
Short-term investments 55 83 66
Total 1,256 1,285 1,284
Investment expenses (39) (23) (25)
Net investment income $1,217 $ 1,262 $ 1,259
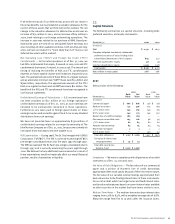
Realized and Unrealized Investment Gains (Losses) — The following
summarizes our pretax realized investment gains and losses, and
the change in unrealized appreciation of investments recorded in
common shareholders’ equity and in comprehensive income.
Year ended December 31 2001 2000 1999
(In millions)
pretax realized investments
gains (losses)
Fixed maturities:
Gross realized gains $28$29$ 10
Gross realized losses (105) (58) (29)
Total fixed maturities (77) (29) (19)
Equities:
Gross realized gains 276 296 224
Gross realized losses (280) (201) (97)
Total equities (4) 95 127
Real estate and mortgage loans 12 418
Venture capital (43) 554 158
Other investments 18 82
Total pretax realized
investment gains (losses) $(94)$ 632 $ 286
change in unrealized appreciation
Fixed maturities $187 $ 457 $ (997)
Equities (347) (199) 223
Venture capital net of minority interest (314) (61) 286
Other (80) 47 (44)
Total change in pretax unrealized
appreciation on continuing
operations (554) 244 (532)
Change in deferred taxes 214 (88) 185
Total change in unrealized
appreciation on continuing
operations, net of taxes (340) 156 (347)
Change in pretax unrealized
appreciation on discontinued
operations 26 63 (173)
Change in deferred taxes (9) (22) 61
Total change in unrealized
appreciation on discontinued
operations, net of taxes 17 41 (112)
Total change in unrealized
appreciation, net of taxes $ (323) $ 197 $ (459)