Travelers 2001 Annual Report Download - page 73
Download and view the complete annual report
Please find page 73 of the 2001 Travelers annual report below. You can navigate through the pages in the report by either clicking on the pages listed below, or by using the keyword search tool below to find specific information within the annual report.-
 1
1 -
2
-
3
-
4
-
5
-
6
-
7
-
8
-
9
-
10
-
11
-
12
-
13
-
14
-
15
-
16
-
17
-
18
-
19
-
20
-
21
-
22
-
23
-
24
-
25
-
26
-
27
-
28
-
29
-
30
-
31
-
32
-
33
-
34
-
35
-
36
-
37
-
38
-
39
-
40
-
41
-
42
-
43
-
44
-
45
-
46
-
47
-
48
-
49
-
50
-
51
-
52
-
53
-
54
-
55
-
56
-
57
-
58
-
59
-
60
-
61
-
62
-
 63
63 -
 64
64 -
 65
65 -
 66
66 -
 67
67 -
 68
68 -
 69
69 -
 70
70 -
 71
71 -
 72
72 -
 73
73 -
 74
74 -
 75
75 -
 76
76 -
 77
77 -
 78
78 -
 79
79 -
 80
80
 |
 |

The St. Paul Companies 2001 Annual Report 71
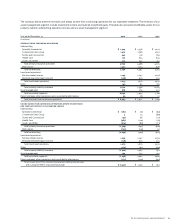
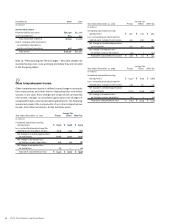
The summary below presents revenues and pretax income from continuing operations for our reportable segments. The revenues of our
asset management segment include investment income and realized investment gains. The table also presents identifiable assets for our
property-liability underwriting operation in total, and our asset management segment.
Year ended December 31 2001 2000 1999
(In millions)
revenues from continuing operations
Underwriting:
Specialty Commercial $ 1,924 $ 1,338 $ 1,274
Commercial Lines Group 1,470 1,368 1,363
Surety and Construction 940 791 789
Health Care 791 624 645
Lloyd’s and Other 574 347 154
Total primary insurance operations 5,699 4,468 4,225
Reinsurance 1,597 1,124 878
Total underwriting 7,296 5,592 5,103
Investment operations:
Net investment income 1,199 1,247 1,256
Realized investment gains (losses) (126) 624 274
Total investment operations 1,073 1,871 1,530
Other 143 95 130
Total property-liability insurance 8,512 7,558 6,763
Asset management 378 376 353
Total reportable segments 8,890 7,934 7,116
Parent company, other operations and consolidating eliminations 53 38 33
Total revenues from continuing operations $ 8,943 $ 7,972 $ 7,149
income (loss) from continuing operations before income taxes
and cumulative effect of accounting change
Underwriting:
Specialty Commercial $ (181) $ (10) $ (191)
Commercial Lines Group 474 (189)
Surety and Construction (33) 68 (27)
Health Care (985) (241) (70)
Lloyd’s and Other (374) (86) (23)
Total primary insurance operations (1,569) (195) (500)
Reinsurance (725) (114) 75
Total underwriting (2,294) (309) (425)
Investment operations:
Net investment income 1,199 1,247 1,256
Realized investment gains (losses) (126) 624 274
Total investment operations 1,073 1,871 1,530
Other (179) (95) (134)
Total property-liability insurance (1,400) 1,467 971
Asset management 142 135 123
Total reportable segments (1,258) 1,602 1,094
Parent company, other operations and consolidating eliminations (173) (201) (143)
Total income (loss) from continuing operations before income taxes
and cumulative effect of accounting change $ (1,431) $ 1,401 $ 951