Travelers 2001 Annual Report Download - page 32
Download and view the complete annual report
Please find page 32 of the 2001 Travelers annual report below. You can navigate through the pages in the report by either clicking on the pages listed below, or by using the keyword search tool below to find specific information within the annual report.-
 1
1 -
2
-
3
-
4
-
5
-
6
-
7
-
8
-
9
-
10
-
11
-
12
-
13
-
14
-
15
-
16
-
17
-
18
-
19
-
20
-
21
-
 22
22 -
 23
23 -
 24
24 -
 25
25 -
 26
26 -
 27
27 -
 28
28 -
 29
29 -
 30
30 -
 31
31 -
 32
32 -
 33
33 -
 34
34 -
 35
35 -
 36
36 -
 37
37 -
 38
38 -
 39
39 -
 40
40 -
 41
41 -
 42
42 -
43
-
44
-
45
-
46
-
47
-
48
-
49
-
50
-
51
-
52
-
53
-
54
-
55
-
56
-
57
-
58
-
59
-
60
-
61
-
62
-
63
-
64
-
65
-
66
-
67
-
68
-
69
-
70
-
71
-
72
-
73
-
74
-
75
-
76
-
77
-
78
-
79
-
80
 |
 |

the MMI acquisition and the elimination of the one-quarter report-
ing lag, fixed maturities investment income was approximately 5%
below comparable 1999 investment income, due to net sales of
investments to fund operational cash needs. Funds available for
investment in the last three years were also reduced by cumulative
premium payments of $639 million related to our corporate rein-
surance program.
Equities – Our equity holdings consist of a diversified portfolio of
common stocks, which accounted for 5% of total investments (at
cost) at Dec. 31, 2001. Equity markets in the United States in 2001
suffered from the economic slowdown and the Sept. 11 terrorist
attack. The total return on our equity portfolio in 2001 (encom-
passing dividend income, realized gains and losses, and the change
in unrealized appreciation) was (20.7%), and our five-year return
through 2001 was approximately 10.5%. Despite the negative return
in 2001, the $1.10 billion market value of our portfolio at Dec. 31,
2001 still exceeded its cost by $52 million. At the end of 2000, the
pretax unrealized appreciation included in the $1.40 billion carrying
value totaled $326 million.
Real Estate and Mortgage Loans – Real estate ($838 million carrying
value) and mortgage loans ($134 million carrying value) comprised
5% of our total property-liability investments at the end of 2001.
Our real estate holdings primarily consist of commercial office and
warehouse properties that we own directly or in which we have a
partial interest through joint ventures. Our properties are geo-
graphically distributed throughout the United States and had an
occupancy rate of 95% at year-end 2001. These investments pro-
duced pretax income of $97 million in 2001 and $63 million in 2000,
and generated cash flows totaling $138 million in 2001 and $90 mil-
lion in 2000. The increase in investment income and cash flows in
2001 was primarily due to earnings from a Southern California res-
idential land development. We did not make any significant real
estate purchases in 2001 or 2000.
We acquired the portfolio of mortgage loans in the 1998 merger
with USF&G. The loans, which are collateralized by income-pro-
ducing real estate, produced investment income of $18 million in
2001 and $27 million in 2000. Net pay downs and repayments of
the loans totaled $51 million in 2001 and $204 million in 2000. We
did not originate any new loans in either of the last two years.
Venture Capital – Venture capital comprised 4% of our invested
assets (at cost) at the end of 2001. These private investments span
a variety of industries but are concentrated in information tech-
nology, health care and consumer products. In 2001, we invested
$289 million in this asset class, compared with $296 million in
2000. Our total return on average net venture capital investments
(encompassing dividend income, realized gains and losses, and
the change in unrealized appreciation) was (41.5%) in 2001. The
negative return in 2001 was driven by a significant decline in the
unrealized appreciation of our investments in the difficult market
environment that characterized the year. Much of this appreciation
had accumulated during favorable market conditions in recent
years. In 2000, our portfolio produced a total pretax return on
average net assets of 52%, primarily the result of pretax realized
gains totaling $554 million for the year. The carrying value of the
venture capital portfolio at year-end 2001 and 2000 included unre-
alized appreciation of $93 million and $406 million, respectively.
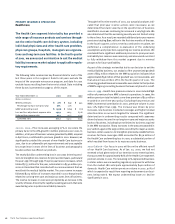
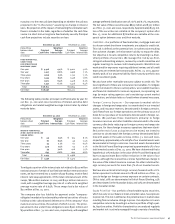
Realized Investment Gains and Losses – The following table sum-
marizes our property-liability operations’ pretax realized gains and
losses by investment class for each of the last three years.
Year ended December 31 2001 2000 1999
(In millions)
pretax realized investment
gains (losses)
Fixed maturities $ (77) $ (29) $ (19)
Equities (4) 87 118
Real estate and mortgage loans 4418
Venture capital (43) 554 158
Other investments (6) 8(1)
Total $ (126) $ 624 $ 274
Pretax realized losses in the fixed maturities category in 2001 were
driven by write-downs in the carrying value of certain of our bond
holdings. These write-downs included a $20 million write-down of
various Argentina government and corporate bonds following eco-
nomic upheaval in that country, and a $19 million write-down in
Enron Corporation bonds following that company’s bankruptcy
filing. The remaining carrying values of our Argentina and Enron
investments at Dec. 31, 2001 totaled $21 million and $5 million,
respectively. Venture capital realized losses in 2001 primarily
resulted from the sale of several of our direct investments.
Venture capital realized gains in 2000 and 1999 were primarily
driven by sales of and distributions from investments in technology-
related companies. The single largest gain in 2000, $117 million,
resulted from the sale of our direct investment in Flycast Com-
munications Corp., a leading provider of Internet direct response
solutions.
2002 Investment Outlook – We do not anticipate investment income
growth in 2002. Although underwriting cash flow in 2002 is
expected to improve due to price increases realized in our continu-
ing operations, that improvement will be diminished by the
anticipated cash payments associated with the runoff of reserves
in businesses that we are exiting and other cash payments, includ-
ing claim payments resulting from the terrorist attack. In addition,
yields on new fixed maturities investments in 2002 are expected to
be lower than those on maturing securities.
With funds provided from maturing investments in 2002, new
investment purchases will be concentrated in taxable, investment-
grade bonds, with additional capital allocated to our other asset
classes as market conditions warrant. We anticipate improving eco-
nomic conditions will improve equity valuations in 2002, but we
expect to realize only modest gains in our venture capital portfolio.
The St. Paul Companies 2001 Annual Report30