Travelers 2001 Annual Report Download - page 14
Download and view the complete annual report
Please find page 14 of the 2001 Travelers annual report below. You can navigate through the pages in the report by either clicking on the pages listed below, or by using the keyword search tool below to find specific information within the annual report.-
 1
1 -
2
-
3
-
 4
4 -
 5
5 -
 6
6 -
 7
7 -
 8
8 -
 9
9 -
 10
10 -
 11
11 -
 12
12 -
 13
13 -
 14
14 -
 15
15 -
 16
16 -
 17
17 -
 18
18 -
 19
19 -
 20
20 -
 21
21 -
 22
22 -
 23
23 -
 24
24 -
25
-
26
-
27
-
28
-
29
-
30
-
31
-
32
-
33
-
34
-
35
-
36
-
37
-
38
-
39
-
40
-
41
-
42
-
43
-
44
-
45
-
46
-
47
-
48
-
49
-
50
-
51
-
52
-
53
-
54
-
55
-
56
-
57
-
58
-
59
-
60
-
61
-
62
-
63
-
64
-
65
-
66
-
67
-
68
-
69
-
70
-
71
-
72
-
73
-
74
-
75
-
76
-
77
-
78
-
79
-
80
 |
 |

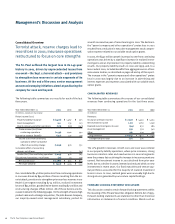
Consolidated Overview
Terrorist attack, reserve charges lead to
record loss in 2001; insurance operations
restructured to focus on core strengths
The St. Paul suffered the largest loss in its 149-year
history in 2001, driven by unprecedented losses from
one event—the Sept. 11 terrorist attack—and provisions
to strengthen loss reserves in certain segments of its
business. At the end of the year, senior management
announced sweeping initiatives aimed at positioning the
company for 2002 and beyond.
The following table summarizes our results for each of the last
three years.
Year ended December 31 2001 2000 1999
(In millions, except per share data)
Pretax income (loss):
Property-liability insurance $ (1,400) $ 1,467 $ 971
Asset management 142 135 123
Parent company and other operations (173) (201) (143)
Pretax income (loss) from
continuing operations (1,431) 1,401 951
Income tax expense (benefit) (422) 431 219
Income (loss) from continuing
operations before cumulative
effect of accounting change (1,009) 970 732
Cumulative effect of accounting
change, net of taxes —— (27)
Income (loss) from continuing operations (1,009) 970 705
Discontinued operations, net of taxes (79) 23 129
Net income (loss) $(1,088) $ 993 $ 834
Per share (diluted) $ (5.22) $ 4.24 $ 3.41
Our consolidated $1.4 billion pretax loss from continuing operations
in 2001 was driven by $941 million of losses resulting from the ter-
rorist attack, provisions to strengthen prior-year loss reserves in our
Health Care segment totaling $735 million, realized investment
losses of $94 million, goodwill write-downs totaling $73 million and
restructuring charges of $62 million. All of these factors are dis-
cussed in detail in the following pages. On the strength of record-high
product sales and a strategic acquisition, The John Nuveen Company,
our majority-owned asset management subsidiary, posted its
seventh consecutive year of record earnings in 2001.The decline in
the “parent company and other operations” pretax loss in 2001
resulted from a reduction in executive management stock compen-
sation expense related to our variable stock option grants.
In 2000, the $450 million growth in pretax income from continuing
operations was driven by a significant increase in realized invest-
ment gains and an improvement in property-liability underwriting
results. Our property-liability results in 2000 and 1999, and, to a
lesser extent 2001, included benefits from aggregate excess-of-loss
reinsurance treaties, as described on pages 18 and 19 of this report.
The increase in the “parent company and other operations” pretax
loss in 2000 was largely due to an increase in advertising and
interest expenses and expenses associated with our variable stock
option grants.
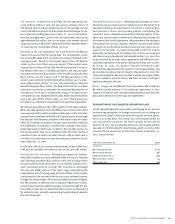
consolidated revenues
The following table summarizes the sources of our consolidated
revenues from continuing operations for the last three years.
Year ended December 31 2001 2000 1999
(In millions)
Revenues:
Insurance premiums earned $ 7,296 $ 5,592 $ 5,103
Net investment income 1,217 1,262 1,259
Realized investment gains (losses) (94) 632 286
Asset management 359 356 340
Other 165 130 161
Total revenues $ 8,943 $ 7,972 $ 7,149
Change from prior year 12% 12%
The 12% growth in revenues in both 2001 and 2000 was centered
in our property-liability operations, where price increases, strong
business retention rates and new business in several segments
were the primary factors driving the increase in insurance premiums
earned. Net investment income in 2001 declined from prior-year
levels due to a decline in assets invested and reduced yields on new
investments in recent years. Our fixed maturities and venture cap-
ital portfolios accounted for the majority of realized investment
losses in 2001. In 2000, realized gains were unusually high due to
strong returns generated by our venture capital holdings.
forward-looking statement disclosure
This discussion contains certain forward-looking statements within
the meaning of the Private Securities Litigation Reform Act of 1995.
Forward-looking statements are statements other than historical
information or statements of current condition. Words such as
The St. Paul Companies 2001 Annual Report12
Management’s Discussion and Analysis