Travelers 2001 Annual Report Download - page 54
Download and view the complete annual report
Please find page 54 of the 2001 Travelers annual report below. You can navigate through the pages in the report by either clicking on the pages listed below, or by using the keyword search tool below to find specific information within the annual report.-
 1
1 -
2
-
3
-
4
-
5
-
6
-
7
-
8
-
9
-
10
-
11
-
12
-
13
-
14
-
15
-
16
-
17
-
18
-
19
-
20
-
21
-
22
-
23
-
24
-
25
-
26
-
27
-
28
-
29
-
30
-
31
-
32
-
33
-
34
-
35
-
36
-
37
-
38
-
39
-
40
-
41
-
42
-
43
-
 44
44 -
 45
45 -
 46
46 -
 47
47 -
 48
48 -
 49
49 -
 50
50 -
 51
51 -
 52
52 -
 53
53 -
 54
54 -
 55
55 -
 56
56 -
 57
57 -
 58
58 -
 59
59 -
 60
60 -
 61
61 -
 62
62 -
 63
63 -
 64
64 -
65
-
66
-
67
-
68
-
69
-
70
-
71
-
72
-
73
-
74
-
75
-
76
-
77
-
78
-
79
-
80
 |
 |

The St. Paul Companies 2001 Annual Report52
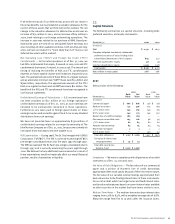
Statutory Deposits — At Dec. 31, 2001, our property-liability
operation had investments in fixed maturities with an estimated fair
value of $852 million on deposit with regulatory authorities as
required by law.
Restricted Investments — Our subsidiaries Unionamerica and
St. Paul Re-U.K. are required, as accredited U.S. reinsurers, to hold
certain investments in trust in the United States. These trust funds
had a fair value of $514 million at Dec. 31, 2001. Additionally,
Unionamerica has funds deposited with third parties to be used as
collateral to secure various liabilities on behalf of insureds, cedants
and other creditors. These funds had a fair value of $53 million at
Dec. 31, 2001.
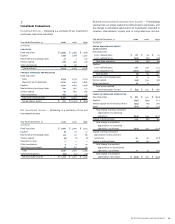
Fixed Maturities by Maturity Date — The following table presents
the breakdown of our fixed maturities by years to stated maturity.
Actual maturities may differ from those stated as a result of calls
and prepayments.
Amortized Estimated
December 31, 2001 Cost Fair Value
(In millions)
One year or less $ 971 $ 986
Over one year through five years 4,586 4,801
Over five years through 10 years 3,457 3,567
Over 10 years 3,725 3,889
Asset-backed securities with
various maturities 115 116
Mortgage-backed securities with
various maturities 2,493 2,552
Total $ 15,347 $ 15,911
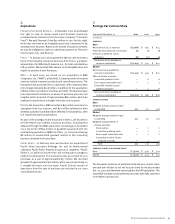
6
Investments
Valuation of Investments — The following presents the cost, gross unrealized appreciation and depreciation, and estimated fair value of
our investments in fixed maturities, equities, venture capital and securities on loan.
Gross Gross
Unrealized Unrealized Estimated
December 31, 2001 Cost Appreciation Depreciation Fair Value
(In millions)
Fixed maturities:
U.S. government $ 1,197 $ 74 $ (1) $ 1,270
State and political subdivisions 4,720 231 (3) 4,948
Foreign governments 1,168 44 (11) 1,201
Corporate securities 5,654 220 (50) 5,824
Asset-backed securities 115 4 (3) 116
Mortgage-backed securities 2,493 65 (6) 2,552
Total fixed maturities 15,347 638 (74) 15,911
Equities 1,415 107 (112) 1,410
Venture capital 766 210 (117) 859
Securities on loan 739 40 (4) 775
Total $18,267 $ 995 $ (307) $18,955
Gross Gross
Unrealized Unrealized Estimated
December 31, 2000 Cost Appreciation Depreciation Fair Value
(In millions)
Fixed maturities:
U.S. government $ 818 $ 35 $ (1) $ 852
State and political subdivisions 5,089 258 (1) 5,346
Foreign governments 999 37 (7) 1,029
Corporate securities 5,021 113 (74) 5,060
Asset-backed securities 117 2 (9) 110
Mortgage-backed securities 2,309 38 (14) 2,333
Total fixed maturities 14,353 483 (106) 14,730
Equities 1,124 418 (76) 1,466
Venture capital 657 438 (31) 1,064
Securities on loan 1,157 65 (15) 1,207
Total $ 17,291 $ 1,404 $ (228) $18,467