Travelers 2001 Annual Report Download - page 36
Download and view the complete annual report
Please find page 36 of the 2001 Travelers annual report below. You can navigate through the pages in the report by either clicking on the pages listed below, or by using the keyword search tool below to find specific information within the annual report.-
 1
1 -
2
-
3
-
4
-
5
-
6
-
7
-
8
-
9
-
10
-
11
-
12
-
13
-
14
-
15
-
16
-
17
-
18
-
19
-
20
-
21
-
22
-
23
-
24
-
25
-
 26
26 -
 27
27 -
 28
28 -
 29
29 -
 30
30 -
 31
31 -
 32
32 -
 33
33 -
 34
34 -
 35
35 -
 36
36 -
 37
37 -
 38
38 -
 39
39 -
 40
40 -
 41
41 -
 42
42 -
 43
43 -
 44
44 -
 45
45 -
 46
46 -
47
-
48
-
49
-
50
-
51
-
52
-
53
-
54
-
55
-
56
-
57
-
58
-
59
-
60
-
61
-
62
-
63
-
64
-
65
-
66
-
67
-
68
-
69
-
70
-
71
-
72
-
73
-
74
-
75
-
76
-
77
-
78
-
79
-
80
 |
 |

Capital structure remains solid,
conservative despite record net loss
in 2001
the st. paul companies
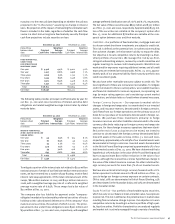
Capital Resources
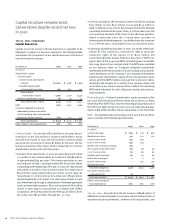
Capital resources consist of funds deployed or available to be
deployed to support our business operations. The following table
summarizes the components of our capital resources at the end of
each of the last three years.
December 31 2001 2000 1999
(In millions)
Shareholders’ equity:
Common equity:
Common stock and retained
earnings $4,692 $ 6,481 $ 5,906
Unrealized appreciation
of investments and other 364 697 542
Total common
shareholders’ equity 5,056 7,178 6,448
Preferred shareholders’ equity 58 49 24
Total shareholders’ equity 5,114 7,227 6,472
Debt 2,130 1,647 1,466
Company-obligated mandatorily
redeemable preferred securities
of trusts holding solely subordinated
debentures of the company 893 337 425
Total capitalization $8,137 $ 9,211 $ 8,363
Ratio of debt to total capitalization 26% 18% 18%
Common Equity – Our net loss of $1.09 billion in 2001 was the pri-
mary factor in the 30% decline in common shareholders’ equity
since the end of 2000. In 2000, the 11% increase in common equity
was driven by net income of nearly $1 billion for the year. The fol-
lowing summarizes other major factors impacting our common
shareholders’ equity in the last three years.
• Common share repurchases. In 2001, we repurchased and retired
13.0 million of our common shares for a total cost of $589 million,
or approximately $45 per share. The share repurchases in 2001
occurred prior to Sept. 11 and represented 6% of our total shares
outstanding at the beginning of the year. In 2000, we repurchased
and retired 17.9 million of our common shares for a total cost of
$536 million (approximately $30 per share), and in 1999, we
repurchased 11.1 million shares for a total cost of $356 million
(approximately $32 per share). The share repurchases in each
year were financed through a combination of internally-generated
funds and new debt issuances. Since our issuance of 66.5 million
shares in April 1998 to consummate our merger with USF&G
Corporation, we had repurchased and retired 45.8 million shares
for a total cost of $1.62 billion through Dec. 31, 2001.
• Common dividends. We declared common dividends totaling
$235 million in 2001, $232 million in 2000 and $235 million in
1999. In February 2002, The St. Paul’s board of directors declared
a quarterly dividend of $0.29 per share, a 3.6% increase over the
2001 quarterly dividend of $0.28 per share. We have paid divi-
dends in every year since 1872. During those 130 years of
uninterrupted dividend payments, our dividend rate has increased
in 70 of those years, including the last 16 consecutive years.
• Conversion of preferred securities. In 2000, our wholly-owned sub-
sidiary, St. Paul Capital LLC, exercised its right to cause the
conversion rights of the owners of its $207 million, 6%
Convertible Monthly Income Preferred Securities (“MIPS”) to
expire. Each of the 4,140,000 MIPS outstanding was convertible
into 1.695 shares of our common stock. The MIPS were classified
on our balance sheet as “Company-obligated mandatorily
redeemable preferred securities of trusts holding solely subordi-
nated debentures of the Company,” as a separate line between
liabilities and shareholders’ equity. Prior to the expiration date,
almost all of the MIPS holders exercised their conversion rights,
resulting in the issuance of 7.0 million of our common shares, and
an increase to our common equity of $207 million. The remaining
MIPS were redeemed for cash at $50 per security, plus accumu-
lated dividends.
Preferred Equity – Preferred shareholders’ equity consisted of the
par value of the Series B preferred shares we issued to our Stock
Ownership Plan (SOP) Trust, less the remaining principal balance of
the SOP Trust debt. During 2001 and 2000, we made principal pay-
ments of $14 million and $37 million, respectively, on the Trust debt.
Debt – Consolidated debt outstanding at the end of the last three
years consisted of the following components.
December 31 2001 2000 1999
(In millions)
Commercial paper $ 606 $ 138 $ 400
Medium-term notes 571 617 617
7.875% senior notes 249 249 –
8.125% senior notes 249 249 –
Nuveen line of credit borrowings 183 ––
Zero coupon convertible notes 103 98 94
7.125% senior notes 80 80 80
Variable rate borrowings 64 64 64
Real estate mortgages 2215
8.375% senior notes –150 150
Floating rate notes ––46
Total debt obligations 2,107 1,647 1,466
Fair value of interest rate
swap agreements 23 ––
Total reported debt $2,130 $ 1,647 $ 1,466
Debt as a percentage of
total capitalization 26% 18% 18%
2001 vs. 2000 – Proceeds from the net issuance of $468 million of
additional commercial paper in 2001 were used to fund a portion of
operational cash requirements, common stock repurchases, and
The St. Paul Companies 2001 Annual Report34