Travelers 2001 Annual Report Download - page 39
Download and view the complete annual report
Please find page 39 of the 2001 Travelers annual report below. You can navigate through the pages in the report by either clicking on the pages listed below, or by using the keyword search tool below to find specific information within the annual report.-
 1
1 -
2
-
3
-
4
-
5
-
6
-
7
-
8
-
9
-
10
-
11
-
12
-
13
-
14
-
15
-
16
-
17
-
18
-
19
-
20
-
21
-
22
-
23
-
24
-
25
-
26
-
27
-
28
-
 29
29 -
 30
30 -
 31
31 -
 32
32 -
 33
33 -
 34
34 -
 35
35 -
 36
36 -
 37
37 -
 38
38 -
 39
39 -
 40
40 -
 41
41 -
 42
42 -
 43
43 -
 44
44 -
 45
45 -
 46
46 -
 47
47 -
 48
48 -
 49
49 -
50
-
51
-
52
-
53
-
54
-
55
-
56
-
57
-
58
-
59
-
60
-
61
-
62
-
63
-
64
-
65
-
66
-
67
-
68
-
69
-
70
-
71
-
72
-
73
-
74
-
75
-
76
-
77
-
78
-
79
-
80
 |
 |

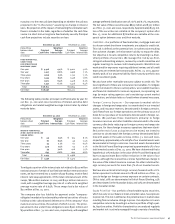
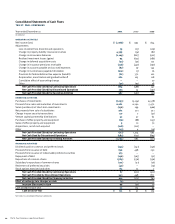
maturity or to the next call date depending on whether the call was
projected to be “in-the-money” assuming no change in interest
rates. No projection of the impact of reinvesting the estimated cash
flows is included in the table, regardless of whether the cash flow
source is a short-term or long-term fixed maturity security. Principal
cash flow projections include securities on loan.
December 31, 2001 December 31, 2000
Period from Weighted Weighted
balance sheet Principal Average Principal Average
date Cash Flows Interest Rate Cash Flows Interest Rate
(In millions)
fixed maturities,
short-term
investments and
mortgage loans
One year $ 4,416 4.4% $ 4,002 5.6%
Two year 2,017 6.6% 1,698 7.1%
Three years 1,616 7.5% 1,710 7.3%
Four years 1,454 6.5% 1,538 7.8%
Five years 1,562 6.4% 1,428 6.3%
Thereafter 7,547 6.2% 7,428 6.4%
Total $ 18,612 $17,804
Fair Value $18,198 $17,222
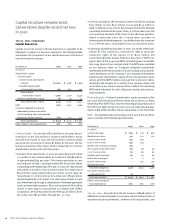
The following table provides principal runoff estimates by year for
our Dec. 31, 2001 and 2000 inventories of interest-sensitive debt
obligations and related weighted average interest rates by stated
maturity dates.
December 31, 2001 December 31, 2000
Period from Weighted Weighted
balance sheet Principal Average Principal Average
date Cash Flows Interest Rate Cash Flows Interest Rate
(In millions)
medium-term notes,
zero coupon notes and
senior notes
One year $49 7.5% $ 195 8.1%
Two year 67 6.5% 49 7.5%
Three years 54 7.1% 67 6.5%
Four years 429 7.5% 55 7.1%
Five years 59 7.0% 428 7.5%
Thereafter 635 6.8% 694 6.8%
Total $ 1,293 $ 1,488
Fair Value $ 1,330 $ 1,475
To mitigate a portion of the interest rate risk related to $230 million
notional amount of certain of our fixed rate medium-term and senior
notes, we have entered into a number of pay-floating, receive-fixed
interest rate swap agreements. Of the total notional amount of the
swaps, $80 million matures in 2005 and $150 million matures in
2008, with a weighted average pay rate of 1.26% and a weighted
average receive rate of 6.64%. These swaps had a fair value of
$23 million at Dec. 31, 2001.
The company also has liability for payment under “company-
obligated mandatorily redeemable preferred securities of trusts
holding solely subordinated debentures of the company” that
mature at various times, the earliest of which is 2027. The princi-
pal amounts due under these obligations were $901 million and
$346 million at Dec. 31, 2001 and 2000, respectively, with weighted
average preferred distribution rates of 7.8 % and 8.1 %, respectively.
The fair value of these securities was $893 million and $327 million
as of Dec. 31, 2001 and 2000, respectively. Approximately $575 mil-
lion of the securities are callable at the company’s option after
Nov. 13, 2006. An additional $78 million are callable at the com-
pany’s option between 2007 and their maturity.
Credit Risk – Our portfolios of fixed maturities, mortgage loans and
to a lesser extent short-term investments are subject to credit risk.
This risk is defined as the potential loss in market value resulting
from adverse changes in the borrower’s ability to repay the debt.
Our objective is to earn competitive returns by investing in a diver-
sified portfolio of securities. We manage this risk by up-front,
stringent underwriting analysis, reviews by a credit committee and
regular meetings to review credit developments. Watchlists are
maintained for exposures requiring additional review, and all credit
exposures are reviewed at least annually. At Dec. 31, 2001, approx-
imately 95% of our property-liability fixed maturity portfolio was
rated investment grade.
We also have other receivable amounts subject to credit risk. The
most significant of these are reinsurance recoverables. To mitigate
credit risk related to these counterparties, we establish business
and financial standards for reinsurer approval, incorporating rat-
ings by major rating agencies and considering current market
information, and obtain letters of credit where deemed necessary.
Foreign Currency Exposure – Our exposure to market risk for
changes in foreign exchange rates is concentrated in our invested
assets, and insurance reserves, denominated in foreign currencies.
Cash flows from our foreign operations are the primary source of
funds for our purchase of investments denominated in foreign cur-
rencies. We purchase these investments primarily to hedge
insurance reserves and other liabilities denominated in the same
currency, effectively reducing our foreign currency exchange rate
exposure. For those foreign insurance operations that were identi-
fied at the end of 2001 as business to be exited, we intend to
continue to closely match the foreign currency-denominated liabil-
ities with assets in the same currency. At Dec. 31, 2001 and 2000,
respectively, approximately 11% and 9% of our invested assets were
denominated in foreign currencies. Invested assets denominated
in the British Pound Sterling comprised approximately 5% of our
total invested assets at Dec. 31, 2001. We have determined that a
hypothetical 10% reduction in the value of the Pound Sterling would
have an approximate $100 million reduction in the value of our
assets, although there would be a similar hypothetical change in
the value of the related insurance reserves. No other individual for-
eign currency accounts for more than 3% of our invested assets.
We have also entered into foreign currency forwards with a U.S.
dollar equivalent notional amount of $128 million as of Dec. 31,
2001 to hedge our foreign currency exposure on certain contracts.
Of this total, 76% are denominated in British Pound Sterling, 14%
are denominated in the Australian dollar, and 10% are denominated
in the Canadian dollar.
Equity Price Risk – Our portfolio of marketable equity securities,
which we carry on our balance sheet at market value, has exposure
to price risk. This risk is defined as the potential loss in market value
resulting from an adverse change in prices. Our objective is to earn
competitive returns by investing in a diverse portfolio of high-qual-
ity, liquid securities. Portfolio characteristics are analyzed regularly
and market risk is actively managed through a variety of modeling
The St. Paul Companies 2001 Annual Report 37