Travelers 2001 Annual Report Download - page 63
Download and view the complete annual report
Please find page 63 of the 2001 Travelers annual report below. You can navigate through the pages in the report by either clicking on the pages listed below, or by using the keyword search tool below to find specific information within the annual report.-
 1
1 -
2
-
3
-
4
-
5
-
6
-
7
-
8
-
9
-
10
-
11
-
12
-
13
-
14
-
15
-
16
-
17
-
18
-
19
-
20
-
21
-
22
-
23
-
24
-
25
-
26
-
27
-
28
-
29
-
30
-
31
-
32
-
33
-
34
-
35
-
36
-
37
-
38
-
39
-
40
-
41
-
42
-
43
-
44
-
45
-
46
-
47
-
48
-
49
-
50
-
51
-
52
-
 53
53 -
 54
54 -
 55
55 -
 56
56 -
 57
57 -
 58
58 -
 59
59 -
 60
60 -
 61
61 -
 62
62 -
 63
63 -
 64
64 -
 65
65 -
 66
66 -
 67
67 -
 68
68 -
 69
69 -
 70
70 -
 71
71 -
 72
72 -
 73
73 -
74
-
75
-
76
-
77
-
78
-
79
-
80
 |
 |

The St. Paul Companies 2001 Annual Report 61
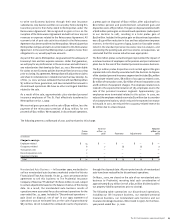
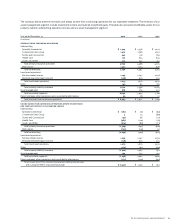
All Plans — The following tables provide a reconciliation of the changes in the plans’ benefit obligations and fair value of assets over the
two-year period ended Dec. 31, 2001, and a statement of the funded status as of Dec. 31, of 2001 and 2000.
Pension Benefits Postretirement Benefits
2001 2000 2001 2000
(In millions)
Change in benefit obligation:
Benefit obligation at beginning of year $ 961 $ 777 $ 221 $189
Service cost 34 27 45
Interest cost 65 61 15 14
Plan amendment 3———
Actuarial (gain) loss (45) 129 11 27
Foreign currency exchange rate change —(1) ——
Acquisition —14 ——
Benefits paid (63) (46) (16) (14)
Curtailment loss (gain) 24 —(24) —
Benefit obligation at end of year $979 $ 961 $211 $ 221
Change in plan assets:
Fair value of plan assets at beginning of year $ 1,206 $ 1,226 $23 $20
Actual return on plan assets (124) 813
Foreign currency exchange rate change —(2) ——
Acquisition —19 ——
Employer contribution 1116 14
Benefits paid (63) (46) (16) (14)
Fair value of plan assets at end of year $ 1,020 $ 1,206 $24 $23
Funded status $41 $ 245 $ (187) $ (198)
Unrecognized transition asset —(2) ——
Unrecognized prior service cost 1(4) 29
Unrecognized net actuarial loss 241 36 16 4
Prepaid (accrued) benefit cost $283 $ 275 $ (169) $ (185)
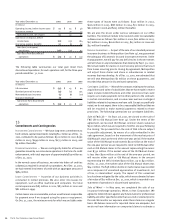
Pension Benefits Postretirement Benefits
2001 2000 2001 2000
Weighted average assumptions as of December 31:
Discount rate 7.00% 6.75% 7.00% 7.25%
Expected return on plan assets 10.00% 10.00% 7.00% 7.00%
Rate of compensation increase 4.00% 4.00% 4.00% 4.00%
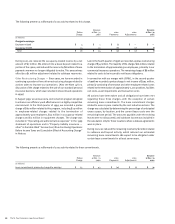
The following table provides the components of our net periodic benefit cost for the years 2001, 2000 and 1999. For the year ended Dec. 31,
1999, the plans’ benefit cost include the impact of curtailment gains related to employee terminations under the third quarter 1999 cost
reduction action and the sale of standard personal insurance.
Pension Benefits Postretirement Benefits
2001 2000 1999 2001 2000 1999
(In millions)
Components of net periodic benefit cost:
Service cost $34 $27 $38 $4 $5 $8
Interest cost 65 61 60 15 14 14
Expected return on plan assets (119) (123) (114) (2) (2) (2)
Amortization of transition asset (1) (2) (1) ———
Amortization of prior service cost (3) (3) (4) —11
Recognized net actuarial loss (gain) —(2) — ———
Net periodic pension cost (income) (24) (42) (21) 17 18 21
Curtailment loss (gain) 17 — (32) (17) —(15)
Net periodic benefit cost (income)
after curtailment $(7) $ (42) $ (53) $— $18 $ 6