Travelers 2001 Annual Report Download - page 46
Download and view the complete annual report
Please find page 46 of the 2001 Travelers annual report below. You can navigate through the pages in the report by either clicking on the pages listed below, or by using the keyword search tool below to find specific information within the annual report.
The St. Paul Companies 2001 Annual Report44
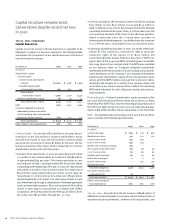
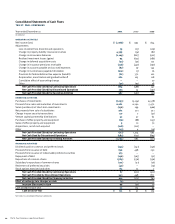
Consolidated Statements of Cash Flows
the st. paul companies
Year ended December 31 2001 2000 1999
(In millions)
operating activities
Net income (loss) $ (1,088) $ 993 $ 834
Adjustments:
Loss (income) from discontinued operations 79 (23) (129)
Change in property-liability insurance reserves 4,399 (34) (82)
Change in reinsurance balances (2,109) (807) (502)
Realized investment losses (gains) 94 (632) (286)
Change in deferred acquisition costs (53) (45) 123
Change in insurance premiums receivable (198) (450) (290)
Change in accounts payable and accrued expenses (87) 29 145
Change in income taxes payable/refundable (212) (3) 26
Provision for federal deferred tax expense (benefit) (81) 372 102
Depreciation, amortization and goodwill writeoff 180 105 118
Cumulative effect of accounting change ——30
Other (40) (93) 58
Net Cash Provided (Used) by Continuing Operations 884 (588) 147
Net Cash Provided (Used) by Discontinued Operations 103 25 (197)
Net Cash Provided (Used) by Operating Activities 987 (563) (50)
investing activities
Purchases of investments (7,033) (5,154) (4,578)
Proceeds from sales and maturities of investments 6,281 6,290 5,472
Sales (purchases) of short-term investments (256) 199 (466)
Net proceeds from sale of subsidiaries 362 201 251
Change in open security transactions 177 7 (47)
Venture capital partnership distributions 52 57 63
Purchase of office property and equipment (70) (88) (153)
Sales of office property and equipment 910 70
Acquisitions, net of cash acquired (218) (212) —
Other (15) 4 (19)
Net Cash Provided (Used) by Continuing Operations (711) 1,314 593
Net Cash Used by Discontinued Operations (583) (632) (894)
Net Cash Provided (Used) by Investing Activities (1,294) 682 (301)
financing activities
Dividends paid on common and preferred stock (245) (241) (246)
Proceeds from issuance of debt 650 498 250
Proceeds from issuance of redeemable preferred securities 575 ——
Repayment of debt (196) (363) (52)
Repurchase of common shares (589) (536) (356)
Subsidiary’s repurchase of common shares (172) (51) (36)
Retirement of preferred securities (40) — (79)
Stock options exercised and other 84 73 7
Net Cash Provided (Used) by Continuing Operations 67 (620) (512)
Net Cash Provided by Discontinued Operations 343 448 873
Net Cash Provided (Used) by Financing Activities 410 (172) 361
Effect of exchange rate changes on cash (4) ——
Increase (Decrease) in Cash 99 (53) 10
Cash at beginning of year 52 105 95
Cash at End of Year $ 151 $ 52 $ 105
See notes to consolidated financial statements.


