Travelers 2001 Annual Report Download - page 24
Download and view the complete annual report
Please find page 24 of the 2001 Travelers annual report below. You can navigate through the pages in the report by either clicking on the pages listed below, or by using the keyword search tool below to find specific information within the annual report.-
 1
1 -
2
-
3
-
4
-
5
-
6
-
7
-
8
-
9
-
10
-
11
-
12
-
13
-
 14
14 -
 15
15 -
 16
16 -
 17
17 -
 18
18 -
 19
19 -
 20
20 -
 21
21 -
 22
22 -
 23
23 -
 24
24 -
 25
25 -
 26
26 -
 27
27 -
 28
28 -
 29
29 -
 30
30 -
 31
31 -
 32
32 -
 33
33 -
 34
34 -
35
-
36
-
37
-
38
-
39
-
40
-
41
-
42
-
43
-
44
-
45
-
46
-
47
-
48
-
49
-
50
-
51
-
52
-
53
-
54
-
55
-
56
-
57
-
58
-
59
-
60
-
61
-
62
-
63
-
64
-
65
-
66
-
67
-
68
-
69
-
70
-
71
-
72
-
73
-
74
-
75
-
76
-
77
-
78
-
79
-
80
 |
 |

Catastrophe Risk underwrites commercial property
coverages for major U.S. corporations and personal prop-
erty coverages in certain states exposed to earthquakes
and hurricanes. Ocean Marine provides insurance cover-
age internationally for ocean and inland waterways
traffic. Umbrella/Excess & Surplus Lines underwrites lia-
bility insurance, umbrella and excess liability coverages,
and coverages for unique risks. Oil&Gasprovides spe-
cialized property and casualty products for customers
involved in the exploration and production of oil and gas.
Transportation offers a broad range of coverage options
for the trucking industry. National Programs underwrites
comprehensive insurance programs that are national in
scope. The International Specialty business center is
comprised of specialty insurance business in several for-
eign countries that is managed on a regional basis.
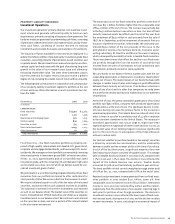
The following table summarizes results for this segment for the last
three years. Data for all three years exclude the impact of the cor-
porate reinsurance program, and data for 2001 also exclude losses
from the terrorist attack. Data including these factors is presented
on page 21 of this report.
Year ended December 31 2001 2000 1999
(Dollars in millions)
Written premiums $2,131 $1,715 $1,361
Percentage increase over prior year 24% 26%
GAAP underwriting result $(81)$ (117) $ (223)
Loss and loss adjustment expense ratio 78.1 78.6 83.4
Underwriting expense ratio 25.3 27.1 32.3
Combined ratio 103.4 105.7 115.7
2001 vs. 2000 – The following discussion analyzes the results of
the respective business centers comprising the Specialty
Commercial segment.
•Financial & Professional Services – Premium volume of $446 mil-
lion in 2001 was 14% higher than 2000 written premiums of
$390 million. The increase was driven by price increases that
averaged 13% for the year, new business in both domestic and
international markets and an incremental $12 million impact
related to our elimination of the one-quarter reporting lag. The
GAAP underwriting loss of $18 million in 2001 improved over the
comparable 2000 loss of $34 million, primarily due to a reduc-
tion in prior-year loss reserves that was partially offset by an
incremental $5 million loss related to our elimination of the one-
quarter reporting lag.
•Technology – Written premiums of $427 million in 2001 grew
24% over comparable 2000 volume of $346 million. The
increase was primarily the result of new business, price
increases averaging 13% for the year and strong renewal reten-
tion rates. The 2001 GAAP underwriting profit of $37 million was
nearly twice the comparable 2000 profit of $19 million, due to
an improvement in current-year loss experience.
•International Specialty – In 2001, written premiums of $319 mil-
lion grew 40% over 2000 premiums of $228 million. The
elimination of the one-quarter reporting lag for a portion of this
business center contributed $38 million of incremental written
premiums in 2001. The remaining growth was centered in
Europe and Canada and was primarily due to price increases.
The GAAP underwriting loss of $97 million in 2001 included $23
million of additional losses resulting from the quarter-lag report-
ing change. Underwriting losses were $94 million in 2000. At the
end of 2001, we announced our intention to withdraw from the
majority of foreign operations that comprise this business center
based on our conclusion that we were unlikely to achieve com-
petitive scale in those geographic locations. We intend to
continue underwriting business in the United Kingdom, Canada
and Ireland.
•Public Sector Services – Written premiums totaled $227 million
in 2001, 29% higher than 2000 premiums of $176 million. In
early 2001, we acquired the right to seek to renew a book of
municipality insurance business from Willis North America Inc.,
which was the primary contributor to premium growth in 2001.
In addition, price increases averaged 11% in this business center
in 2001. The GAAP underwriting profit of $10 million in 2001 was
much improved over the comparable 2000 loss of $10 million,
primarily due to favorable prior-year loss development.
•Umbrella/ Excess & Surplus Lines – Written premiums of
$144 million in 2001 grew 47% over comparable 2000 premium
volume of $98 million. The launch of a new umbrella facility for
retail agents and brokers was the primary contributor to pre-
mium growth in 2001. The GAAP underwriting loss of $36 million
was worse than the 2000 loss of $25 million, primarily due to
adverse prior-year loss development.
•Discover Re – Gross written premiums increased 64% to
$712 million in 2001, and net written premiums of $127 million
grew 33% over 2000 net premium volume of $96 million. Price
increases averaged approximately 25% in 2001, while client
retention ratios exceeded 80%. The GAAP underwriting profit of
$9 million in 2001 was slightly improved over the comparable
2000 profit of $8 million.
•National Programs – Premium volume of $106 million in 2001
was 15% higher than 2000 written premiums of $92 million.
Price increases averaged 19% in 2001, accounting for the major-
ity of premium growth for the year. The 2001 GAAP underwriting
loss of $25 million deteriorated slightly from the comparable
2000 loss of $22 million, primarily due to adverse prior-year loss
development on selected accounts. Current-year loss experience
improved significantly over comparable 2000 results.
The St. Paul Companies 2001 Annual Report22