Travelers 2001 Annual Report Download - page 59
Download and view the complete annual report
Please find page 59 of the 2001 Travelers annual report below. You can navigate through the pages in the report by either clicking on the pages listed below, or by using the keyword search tool below to find specific information within the annual report.-
 1
1 -
2
-
3
-
4
-
5
-
6
-
7
-
8
-
9
-
10
-
11
-
12
-
13
-
14
-
15
-
16
-
17
-
18
-
19
-
20
-
21
-
22
-
23
-
24
-
25
-
26
-
27
-
28
-
29
-
30
-
31
-
32
-
33
-
34
-
35
-
36
-
37
-
38
-
39
-
40
-
41
-
42
-
43
-
44
-
45
-
46
-
47
-
48
-
 49
49 -
 50
50 -
 51
51 -
 52
52 -
 53
53 -
 54
54 -
 55
55 -
 56
56 -
 57
57 -
 58
58 -
 59
59 -
 60
60 -
 61
61 -
 62
62 -
 63
63 -
 64
64 -
 65
65 -
 66
66 -
 67
67 -
 68
68 -
 69
69 -
70
-
71
-
72
-
73
-
74
-
75
-
76
-
77
-
78
-
79
-
80
 |
 |

The St. Paul Companies 2001 Annual Report 57
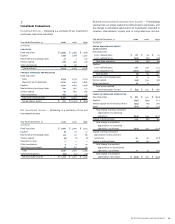
If we believe that all of our deferred tax assets will not result in
future tax benefits, we must establish a valuation allowance for the
portion of these assets that we think will not be realized. The net
change in the valuation allowance for deferred tax assets was an
increase of $74 million in 2001, and an increase of $24 million in
2000, both relating to our foreign underwriting operations. The
increase in 2000 was related to our purchase of MMI. Based pre-
dominantly upon a review of our anticipated future earnings, but
also including all other available evidence, both positive and neg-
ative, we have concluded it is “more likely than not” that our net
deferred tax assets will be realized.
Net Operating Loss (“NOL”) and Foreign Tax Credit (“FTC”)
Carryforwards — For tax return purposes, as of Dec. 31, 2001, we
had NOL carryforwards that expire, if unused, in 2005-2021 and FTC
carryforwards that expire, if unused, in 2005-2006. The amount and
timing of realizing the benefits of NOL and FTC carryforwards
depends on future taxable income and limitations imposed by tax
laws. The approximate amounts of those NOLs on a regular tax basis
and an alternative minimum tax (“AMT”) basis were $1.4 billion and
$366 million, respectively. The approximate amounts of the FTCs
both on a regular tax basis and an AMT basis were $11 million. The
benefits of the NOL and FTC carryforwards have been recognized in
our financial statements.
Undistributed Earnings of Subsidiaries — U.S. income taxes have
not been provided on $72 million of our foreign operations’
undistributed earnings as of Dec. 31, 2001, as such earnings are
intended to be permanently reinvested in those operations.
Furthermore, any taxes paid to foreign governments on these
earnings may be used as credits against the U.S. tax on any dividend
distributions from such earnings.
We have not provided taxes on approximately $336 million of
undistributed earnings related to our majority ownership of The
John Nuveen Company as of Dec. 31, 2001, because we currently do
not expect those earnings to become taxable to us.
IRS Examinations — During 1998, The St. Paul merged with USF&G
Corporation (“USF&G”). The IRS is currently examining USF&G’s
pre-merger consolidated returns for the years 1992 through 1997.
The IRS has examined The St. Paul’s pre-merger consolidated returns
through 1997 and is currently examining the years 1998 through
2000. We believe that any additional taxes assessed as a result of
these examinations would not materially affect our overall financial
position, results of operations or liquidity.
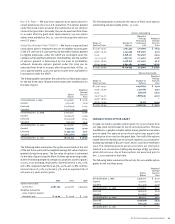
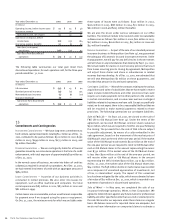
11
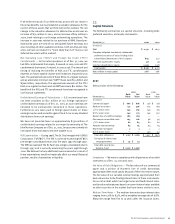
Capital Structure
The following summarizes our capital structure, including debt,
preferred securities, and equity instruments.
December 31 2001 2000
(In millions)
Debt $2,130 $ 1,647
Company-obligated mandatorily redeemable
preferred securities of trusts holding solely
subordinated debentures of the Company 893 337
Preferred shareholders’ equity 58 49
Common shareholders’ equity 5,056 7,178
Total capital $8,137 $9,211
Ratio of debt to total capital 26% 18%
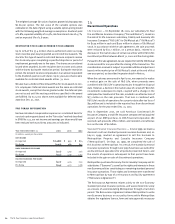
debt
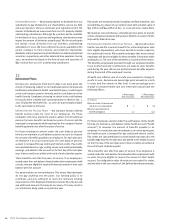
Debt consists of the following.
2001 2000
Book Fair Book Fair
December 31 Value Value Value Value
(In millions)
Commercial paper $ 606 $ 606 $138$138
Medium-term notes 571 596 617 619
7 7
⁄8% senior notes 249 269 249 261
8 1
⁄8% senior notes 249 275 249 267
Nuveen line of credit borrowings 183 183 ——
Zero coupon convertible notes 103 106 98 95
7 1
⁄8% senior notes 80 84 80 82
Variable rate borrowings 64 64 64 64
Real estate mortgages 22 22
8 3
⁄8% senior notes —— 150 151
Total debt obligations $ 2,107 $ 2,185 $ 1,647 $ 1,679
Fair value of interest rate
swap agreements $23$23
Total debt reported on
balance sheet $ 2,130 $ 2,208
Compliance — We were in compliance with all provisions of our debt
covenants as of Dec. 31, 2001 and 2000.
Fair Value of Debt Obligations — The fair values of our commercial
paper and a portion of Nuveen’s line of credit borrowings
approximated their book values because of their short-term nature.
The fair value of our variable rate borrowings approximated their
book values due to the floating interest rates of these instruments.
For our other debt, which has longer terms and fixed interest rates,
our fair value estimate was based on current interest rates available
on debt securities in the market that have terms similar to ours.
Medium-Term Notes — The medium-term notes bear interest rates
ranging from 5.9% to 8.4%, with a weighted average rate of 6.8%.
Maturities range from five to 15 years after the issuance dates.