Travelers 2001 Annual Report Download - page 3
Download and view the complete annual report
Please find page 3 of the 2001 Travelers annual report below. You can navigate through the pages in the report by either clicking on the pages listed below, or by using the keyword search tool below to find specific information within the annual report.-
 1
1 -
 2
2 -
 3
3 -
 4
4 -
 5
5 -
 6
6 -
 7
7 -
 8
8 -
 9
9 -
 10
10 -
 11
11 -
 12
12 -
 13
13 -
 14
14 -
15
-
16
-
17
-
18
-
19
-
20
-
21
-
22
-
23
-
24
-
25
-
26
-
27
-
28
-
29
-
30
-
31
-
32
-
33
-
34
-
35
-
36
-
37
-
38
-
39
-
40
-
41
-
42
-
43
-
44
-
45
-
46
-
47
-
48
-
49
-
50
-
51
-
52
-
53
-
54
-
55
-
56
-
57
-
58
-
59
-
60
-
61
-
62
-
63
-
64
-
65
-
66
-
67
-
68
-
69
-
70
-
71
-
72
-
73
-
74
-
75
-
76
-
77
-
78
-
79
-
80
 |
 |

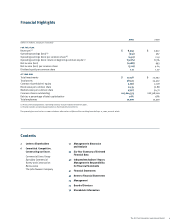
The St. Paul Companies 2001 Annual Report 1
2001 2000
(Dollars in millions, except per share data)
for the year
Revenues(1) $ 8,943 $ 7,972
Operating earnings (loss)(1) (941) 567
Operating earnings (loss) per common share(1) (4.52) 2.41
Operating earnings (loss) return on beginning common equity(2) (13.6%) 8.5%
Net income (loss) (1,088) 993
Net income (loss) per common share (5.22) 4.24
Dividends paid per common share 1.11 1.07
at year end
Total investments $ 22,178 $ 22,052
Total assets 38,321 35,502
Common shareholders’ equity 5,056 7,178
Book value per common share 24.35 32.88
Market value per common share 43.97 54.31
Common shares outstanding 207,624,375 218,308,016
Debt as a percentage of total capitalization 26% 18%
Total employees 10,200 10,500
(1) From continuing operations. Operating earnings exclude realized investment gains.
(2) Equity excludes unrealized appreciation on fixed maturity investments.
The operating loss and net loss in 2001 include an after-tax loss of $612 million resulting from the Sept. 11, 2001, terrorist attack.
Financial Highlights
Contents
2Letter to Shareholders
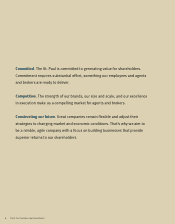
6Committed. Competitive.
Constructing our future.
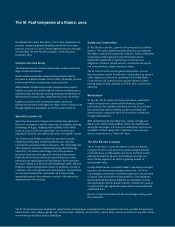
Commercial Lines Group
Specialty Commercial
Surety and Construction
Reinsurance
The John Nuveen Company
12 Management’s Discussion
and Analysis
39 Six-Year Summary of Selected
Financial Data
40 Independent Auditors’ Report,
Management’s Responsibility
for Financial Statements
41 Financial Statements
45 Notes to Financial Statements
74 Management
75 Board of Directors
76 Shareholder Information