Travelers 2001 Annual Report Download - page 31
Download and view the complete annual report
Please find page 31 of the 2001 Travelers annual report below. You can navigate through the pages in the report by either clicking on the pages listed below, or by using the keyword search tool below to find specific information within the annual report.-
 1
1 -
2
-
3
-
4
-
5
-
6
-
7
-
8
-
9
-
10
-
11
-
12
-
13
-
14
-
15
-
16
-
17
-
18
-
19
-
20
-
 21
21 -
 22
22 -
 23
23 -
 24
24 -
 25
25 -
 26
26 -
 27
27 -
 28
28 -
 29
29 -
 30
30 -
 31
31 -
 32
32 -
 33
33 -
 34
34 -
 35
35 -
 36
36 -
 37
37 -
 38
38 -
 39
39 -
 40
40 -
 41
41 -
42
-
43
-
44
-
45
-
46
-
47
-
48
-
49
-
50
-
51
-
52
-
53
-
54
-
55
-
56
-
57
-
58
-
59
-
60
-
61
-
62
-
63
-
64
-
65
-
66
-
67
-
68
-
69
-
70
-
71
-
72
-
73
-
74
-
75
-
76
-
77
-
78
-
79
-
80
 |
 |

property-liability insurance
Investment Operations
Our investment operations’ primary objective is to maximize invest-
ment returns and generate sufficient liquidity to fund our cash
requirements, primarily consisting of insurance claim payments. The
funds we invest are generated by underwriting cash flows, consisting
of premiums collected less losses and expenses paid, and by invest-
ment cash flows, consisting of income received on existing
investments and proceeds from sales and maturities of investments.
The majority of funds available for investment are deployed in a
widely diversified portfolio of predominantly investment-grade fixed
maturities, consisting primarily of government-issued securities and
corporate bonds. We also invest lesser amounts in equity securities,
venture capital and real estate with the goal of producing long-term
growth in the value of our invested asset base and ultimately
enhancing shareholder value. The latter three investment classes
have the potential for higher returns but also involve a greater
degree of risk, including less stable rates of return and less liquidity.
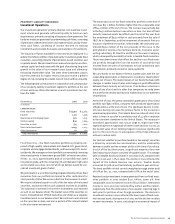
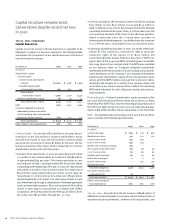
The following table summarizes the composition and carrying value
of our property-liability investment segment’s portfolio at the end
of 2001 and 2000. More information on each investment class fol-
lows the table.
December 31 2001 2000
(In millions)
carrying value
Fixed maturities $ 15,756 $14,584
Equities 1,110 1,396
Real estate and mortgage loans 972 1,025
Venture capital 859 1,064
Securities on loan 775 1,207
Short-term investments 2,043 2,223
Other investments 67 183
Total investments $21,582 $21,682
Fixed Maturities – Our fixed maturities portfolio is primarily com-
posed of high-quality, intermediate-term taxable U.S. government,
corporate and mortgage-backed bonds, and tax-exempt U.S. munic-
ipal bonds. We manage our bond portfolio conservatively, investing
almost exclusively in investment-grade (BBB- or better) securities.
At Dec. 31, 2001, approximately 95% of our portfolio was rated
investment grade, with the remaining 5% split between high-yield
and nonrated securities, most of which we believe would be con-
sidered investment-grade if rated.
We participate in a securities lending program whereby certain fixed
maturities from our portfolio are loaned to other institutions for
short periods of time. We receive a fee from the borrower in return.
We require collateral equal to 102% of the fair value of the loaned
securities, and we record the cash collateral received as a liability.
The collateral is invested in short-term investments and reported
as such on our balance sheet. The market value of the securities on
loan is reclassified out of fixed maturities and shown as a separate
investment asset on our balance sheet. We continue to earn interest
on the securities on loan, and earn a portion of the interest related
to the short-term investments.
The amortized cost of our fixed maturities portfolio at the end of
2001 was $15.2 billion, $1 billion higher than the comparable total
of $14.2 billion at the end of 2000. The increase was partially due
to the $432 million decline in securities on loan. Our level of fixed
maturity invested assets benefited near the end of the year from
the investment of $335 million in cash proceeds from the sale of
F&G Life in September, and the investment of proceeds from our
issuance of preferred securities in November. We ultimately con-
tributed $500 million of the net proceeds of the issue to the
policyholders’ surplus of our primary domestic insurance under-
writing subsidiary, St. Paul Fire and Marine Insurance Company,
which subsequently invested the funds in taxable fixed maturities.
These investments more than offset the decline in our fixed matu-
rity portfolio through the first nine months of 2001 which had
resulted from net sales of investments to fund operational cash
requirements (primarily insurance claim payments).
We carry bonds on our balance sheet at market value, with the cor-
responding appreciation or depreciation recorded in shareholders’
equity, net of taxes. The market values of our bonds fluctuate with
changes in market interest rates and changes in yield differentials
between fixed-maturity asset classes. If we believe a decline in
value of any of our bonds is other than temporary, we write down
the asset for the decline and record a realized loss on our statement
of operations.
At the end of 2001, the pretax unrealized appreciation of our bond
portfolio was $563 million, compared with unrealized appreciation
of $380 million at the end of 2000. The significant decline in inter-
est rates during 2001 was the primary factor in the increase in
unrealized appreciation. The Federal Reserve reduced short-term
rates 11 times in 2001 for a cumulative total of 4.75% in response
to the economic slowdown in the United States. The increase in
unrealized appreciation was not as large as might have been
expected given the magnitude of interest rate declines in 2001, as
the market value of our holdings began to increase significantly
prior to the end of 2000 in anticipation of the Federal Reserve
actions to reduce rates.
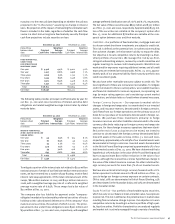
Our decision whether to purchase taxable or tax-exempt securities
is driven by corporate tax considerations, and the relationship
between taxable and tax-exempt yields at the time of purchase.
In each of the last three years, a significant majority of our new
fixed maturity purchases consisted of taxable bonds. The average
yield on taxable bonds purchased in 2001 was 6.5%, compared with
7.7% in 2000 and 7.2% in 1999. The decline in 2001 reflected the
impact of the Federal Reserve rate actions. Taxable bonds
accounted for 70% of our fixed maturity portfolio at year-end 2001.
The bond portfolio in total carried a weighted average pretax yield
of 6.6% at Dec. 31, 2001, compared with 6.8% at the end of 2000.
Reported pretax investment income generated from our fixed matu-
rities portfolio in 2001 totaled $1.11 billion, down 5% from
comparable 2000 investment income of $1.16 billion. Investment
income in 2001 and 2000 included $14 million and $11 million,
respectively, from the elimination of one-quarter reporting lags in
each year for portions of our foreign operations. The decline in
investment income in 2001 reflected the lower level of fixed matu-
rity invested assets during much of 2001 and the decline in yields
on new investments. In 2000, excluding the incremental impact of
The St. Paul Companies 2001 Annual Report 29