Travelers 2001 Annual Report Download - page 21
Download and view the complete annual report
Please find page 21 of the 2001 Travelers annual report below. You can navigate through the pages in the report by either clicking on the pages listed below, or by using the keyword search tool below to find specific information within the annual report.-
 1
1 -
2
-
3
-
4
-
5
-
6
-
7
-
8
-
9
-
10
-
 11
11 -
 12
12 -
 13
13 -
 14
14 -
 15
15 -
 16
16 -
 17
17 -
 18
18 -
 19
19 -
 20
20 -
 21
21 -
 22
22 -
 23
23 -
 24
24 -
 25
25 -
 26
26 -
 27
27 -
 28
28 -
 29
29 -
 30
30 -
 31
31 -
32
-
33
-
34
-
35
-
36
-
37
-
38
-
39
-
40
-
41
-
42
-
43
-
44
-
45
-
46
-
47
-
48
-
49
-
50
-
51
-
52
-
53
-
54
-
55
-
56
-
57
-
58
-
59
-
60
-
61
-
62
-
63
-
64
-
65
-
66
-
67
-
68
-
69
-
70
-
71
-
72
-
73
-
74
-
75
-
76
-
77
-
78
-
79
-
80
 |
 |

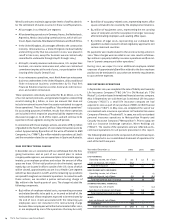
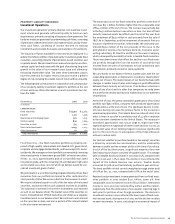
Year ended December 31 2001 2000 1999
(In millions)
corporate program:
Ceded written premiums $9$ 419 $ 211
Ceded losses and loss
adjustment expenses (25) 709 384
Ceded earned premiums 9419 211
Net pretax benefit (detriment) (34) 290 173
reinsurance segment treaty:
Ceded written premiums 119 55 62
Ceded losses and loss
adjustment expenses 278 122 150
Ceded earned premiums 119 55 62
Net pretax benefit 159 67 88
combined total:
Ceded written premiums 128 474 273
Ceded losses and loss
adjustment expenses 253 831 534
Ceded earned premiums 128 474 273
Net pretax benefit $125 $ 357 $ 261
We did not cede any losses to the corporate program in 2001. The
$9 million written and earned premiums ceded in 2001 represent
the initial premium paid to our reinsurer. Our primary purpose in
entering into the corporate reinsurance treaty was to reduce the
volatility in our reported earnings over time. Because of the mag-
nitude of losses associated with the Sept. 11 terrorist attack, that
purpose could not be fulfilled had the treaty been invoked to its full
capacity in 2001. In addition, our actuarial analysis concluded that
there would be little, if any, economic value to The St. Paul in ceding
any losses under the treaty. As a result, in early 2002, we mutually
agreed with our reinsurer to commute the 2001 corporate treaty
for consideration to the reinsurer equaling the $9 million initial
premium paid.
The $25 million of negative ceded losses and loss adjustment
expenses in 2001 in the above table represented the results of a
change in estimate for losses ceded under our 2000 corporate
treaty. Deterioration in our 2000 accident year loss experience in
2001 caused our expectations of the payout patterns of our
reinsurer to change and led us to conclude that losses originally
ceded in 2000 would exceed an economic limit prescribed in the
2000 treaty.
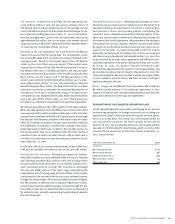
The combined pretax benefit (detriment) of the reinsurance treaties
was allocated to our business segments as follows.
Year ended December 31 2001 2000 1999
(In millions)
Specialty Commercial $ (11) $107 $ 32
Commercial Lines Group 40 (24) 45
Surety and Construction 15 45 21
Health Care (1) 43 –
Lloyd’s and Other (18) 59 –
Total Primary Insurance 25 230 98
Reinsurance 100 127 163
Total Property-Liability Insurance $125 $ 357 $ 261
Amounts shown for 2001 include not only the allocation of the
$34 million detriment from the corporate treaty described above,
but also the reallocation among segments of benefits originally
recorded in 2000 and 1999 related to the corporate treaties in those
years. The reallocation of benefits had no net impact on reported
underwriting results in 2001, but was necessary to reflect the impact
of differences between actual 2001 experience on losses ceded in
2000 and 1999, by segment, and the anticipated experience on
those losses in 2000 and 1999 when the initial segment allocation
was made. All allocations shown for 2000 and 1999 have been
reclassified among segments to be consistent with our new
segment reporting structure implemented in 2001.
The terrorist attack, reinsurance treaties and several other factors
had a significant impact on our reported loss and expense ratios,
as detailed in the following discussion.
Loss Ratio – The loss ratio measures insurance losses and loss
adjustment expenses incurred as a percentage of earned premiums.
The following table summarizes major factors impacting our
reported loss ratio in each of the last three years. The adjusted loss
ratio excludes the impact of those factors and is shown to provide a
clearer understanding of our underlying performance.
Year ended December 31 2001 2000 1999
Reported loss ratio 102.5 70.0 72.9
Adjustments:
Terrorist attack (13.9) ––
Other catastrophe losses (2.2) (3.0) (5.0)
Health Care prior-year reserve provisions (10.0) (4.0) –
Excess-of-loss reinsurance treaties 1.6 8.2 6.2
Adjusted loss ratio 78.0 71.2 74.1
The St. Paul Companies 2001 Annual Report 19