Pitney Bowes 2010 Annual Report Download - page 98
Download and view the complete annual report
Please find page 98 of the 2010 Pitney Bowes annual report below. You can navigate through the pages in the report by either clicking on the pages listed below, or by using the keyword search tool below to find specific information within the annual report.-
 1
1 -
2
-
3
-
4
-
5
-
6
-
7
-
8
-
9
-
10
-
11
-
12
-
13
-
14
-
15
-
16
-
17
-
18
-
19
-
20
-
21
-
22
-
23
-
24
-
25
-
26
-
27
-
28
-
29
-
30
-
31
-
32
-
33
-
34
-
35
-
36
-
37
-
38
-
39
-
40
-
41
-
42
-
43
-
44
-
45
-
46
-
47
-
48
-
49
-
50
-
51
-
52
-
53
-
54
-
55
-
56
-
57
-
58
-
59
-
60
-
61
-
62
-
63
-
64
-
65
-
66
-
67
-
68
-
69
-
70
-
71
-
72
-
73
-
74
-
75
-
76
-
77
-
78
-
79
-
80
-
81
-
82
-
83
-
84
-
85
-
86
-
87
-
 88
88 -
 89
89 -
 90
90 -
 91
91 -
 92
92 -
 93
93 -
 94
94 -
 95
95 -
 96
96 -
 97
97 -
 98
98 -
 99
99 -
 100
100 -
 101
101 -
 102
102 -
 103
103 -
 104
104 -
 105
105 -
 106
106 -
 107
107 -
 108
108 -
109
-
110
-
111
-
112
-
113
-
114
-
115
-
116
-
117
-
118
-
119
-
120
-
121
-
122
-
123
-
124
-
125
-
126
 |
 |

PITNEY BOWES INC.
NOTES TO CONSOLIDATED FINANCIAL STATEMENTS
(Tabular dollars in thousands, except per share data)
79
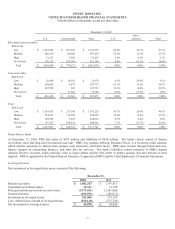
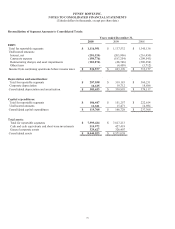
Reconciliation of Segment Amounts to Consolidated Totals:
Years ended December 31,
2010 2009 2008
EBIT:
Total for reportable segments $ 1,116,951 $ 1,137,532 $ 1,345,136
Unallocated amounts:
Interest, net (201,324) (203,906) (216,450)
Corporate expense (198,776) (187,254) (209,543)
Restructuring charges and asset impairments (182,274) (48,746) (200,254)
Other items - (4,450) (5,712)
Income from continuing operations before income taxes $ 534,577 $ 693,176 $ 713,177
Depreciation and amortization:
Total for reportable segments $ 287,038 $ 319,183 $ 360,231
Corporate depreciation 16,615 19,712 18,886
Consolidated depreciation and amortization $ 303,653 $ 338,895 $ 379,117
Capital expenditures:
Total for reportable segments $ 106,447 $ 151,257 $ 222,614
Unallocated amounts 13,321 15,471 14,694
Consolidated capital expenditures $ 119,768 $ 166,728 $ 237,308
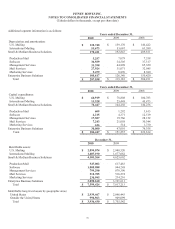
Total assets:
Total for reportable segments $ 7,599,424 $ 7,817,213
Cash and cash equivalents and short-term investments 514,972 427,419
General corporate assets 329,627 326,407
Consolidated assets $ 8,444,023 $ 8,571,039