Pitney Bowes 2010 Annual Report Download - page 100
Download and view the complete annual report
Please find page 100 of the 2010 Pitney Bowes annual report below. You can navigate through the pages in the report by either clicking on the pages listed below, or by using the keyword search tool below to find specific information within the annual report.-
 1
1 -
2
-
3
-
4
-
5
-
6
-
7
-
8
-
9
-
10
-
11
-
12
-
13
-
14
-
15
-
16
-
17
-
18
-
19
-
20
-
21
-
22
-
23
-
24
-
25
-
26
-
27
-
28
-
29
-
30
-
31
-
32
-
33
-
34
-
35
-
36
-
37
-
38
-
39
-
40
-
41
-
42
-
43
-
44
-
45
-
46
-
47
-
48
-
49
-
50
-
51
-
52
-
53
-
54
-
55
-
56
-
57
-
58
-
59
-
60
-
61
-
62
-
63
-
64
-
65
-
66
-
67
-
68
-
69
-
70
-
71
-
72
-
73
-
74
-
75
-
76
-
77
-
78
-
79
-
80
-
81
-
82
-
83
-
84
-
85
-
86
-
87
-
88
-
89
-
 90
90 -
 91
91 -
 92
92 -
 93
93 -
 94
94 -
 95
95 -
 96
96 -
 97
97 -
 98
98 -
 99
99 -
 100
100 -
 101
101 -
 102
102 -
 103
103 -
 104
104 -
 105
105 -
 106
106 -
 107
107 -
 108
108 -
 109
109 -
 110
110 -
111
-
112
-
113
-
114
-
115
-
116
-
117
-
118
-
119
-
120
-
121
-
122
-
123
-
124
-
125
-
126
 |
 |

PITNEY BOWES INC.
NOTES TO CONSOLIDATED FINANCIAL STATEMENTS
(Tabular dollars in thousands, except per share data)
81
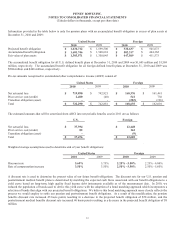
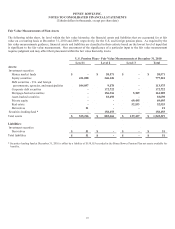
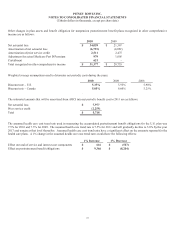
Information provided in the table below is only for pension plans with an accumulated benefit obligation in excess of plan assets at
December 31, 2010 and 2009:
United States Foreign
2010 2009 2010 2009
Projected benefit obligation $ 1,630,712 $ 1,599,506 $ 538,637 $ 505,673
Accumulated benefit obligation $ 1,601,746 $ 1,568,618 $ 502,317 $ 464,362
Fair value of plan assets $ 1,383,571 $ 1,350,045 $ 447,569 $ 411,573
The accumulated benefit obligation for all U.S. defined benefit plans at December 31, 2010 and 2009 was $1,603 million and $1,569
million, respectively. The accumulated benefit obligation for all foreign defined benefit plans at December 31, 2010 and 2009 was
$504 million and $466 million, respectively.
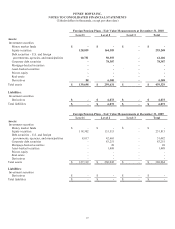
Pre-tax amounts recognized in accumulated other comprehensive income (AOCI) consist of:
United States Foreign
2010 2009 2010 2009
Net actuarial loss $ 719,890 $ 742,921 $ 168,376 $ 161,441
Prior service cost/(credit) 2,400 (40) 541 756
Transition obligation (asset) - - (282) (196)
Total $ 722,290 $ 742,881 $ 168,635 $ 162,001
The estimated amounts that will be amortized from AOCI into net periodic benefits cost in 2011 are as follows:
U.S. Forei
g
n
Net actuarial loss $ 37,394 $ 12,448
Prior service cost/(credit) 82 163
Transition obligation (asset) - (9)
Total $ 37,476 $ 12,602
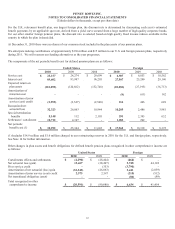
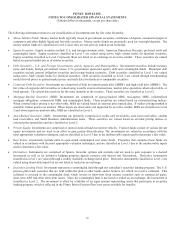
Weighted average assumptions used to determine end of year benefit obligations:
United States Forei
g
n
2010 2009 2010 2009
Discount rate 5.60% 5.75% 2.25% - 5.50% 2.25% - 6.00%
Rate of compensation increase 3.50% 3.50% 2.50% - 5.50% 2.50% - 5.60%
A discount rate is used to determine the present value of our future benefit obligations. The discount rate for our U.S. pension and
postretirement medical benefit plans is determined by matching the expected cash flows associated with our benefit obligations to a
yield curve based on long-term, high quality fixed income debt instruments available as of the measurement date. In 2010, we
reduced the population of bonds used to derive this yield curve with the adoption of a bond matching approach which incorporates a
selection of bonds that align with our projected benefit obligations. We believe this bond matching approach more closely reflects the
process we would employ to settle our pension and postretirement benefit obligations. As a result of this modification, the pension
benefits discount rate increased 45 basis points resulting in a decrease in the projected benefit obligation of $78 million, and the
postretirement medical benefits discount rate increased 40 basis points resulting in a decrease in the projected benefit obligation of $8
million.