Pitney Bowes 2010 Annual Report Download - page 93
Download and view the complete annual report
Please find page 93 of the 2010 Pitney Bowes annual report below. You can navigate through the pages in the report by either clicking on the pages listed below, or by using the keyword search tool below to find specific information within the annual report.-
 1
1 -
2
-
3
-
4
-
5
-
6
-
7
-
8
-
9
-
10
-
11
-
12
-
13
-
14
-
15
-
16
-
17
-
18
-
19
-
20
-
21
-
22
-
23
-
24
-
25
-
26
-
27
-
28
-
29
-
30
-
31
-
32
-
33
-
34
-
35
-
36
-
37
-
38
-
39
-
40
-
41
-
42
-
43
-
44
-
45
-
46
-
47
-
48
-
49
-
50
-
51
-
52
-
53
-
54
-
55
-
56
-
57
-
58
-
59
-
60
-
61
-
62
-
63
-
64
-
65
-
66
-
67
-
68
-
69
-
70
-
71
-
72
-
73
-
74
-
75
-
76
-
77
-
78
-
79
-
80
-
81
-
82
-
 83
83 -
 84
84 -
 85
85 -
 86
86 -
 87
87 -
 88
88 -
 89
89 -
 90
90 -
 91
91 -
 92
92 -
 93
93 -
 94
94 -
 95
95 -
 96
96 -
 97
97 -
 98
98 -
 99
99 -
 100
100 -
 101
101 -
 102
102 -
 103
103 -
104
-
105
-
106
-
107
-
108
-
109
-
110
-
111
-
112
-
113
-
114
-
115
-
116
-
117
-
118
-
119
-
120
-
121
-
122
-
123
-
124
-
125
-
126
 |
 |

PITNEY BOWES INC.
NOTES TO CONSOLIDATED FINANCIAL STATEMENTS
(Tabular dollars in thousands, except per share data)
74
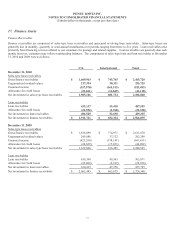
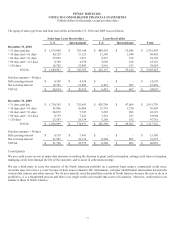
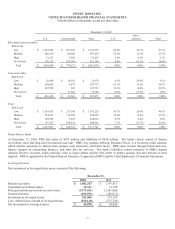
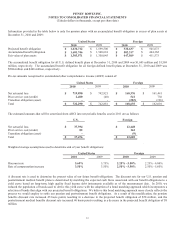
The table below shows the portfolio at December 31, 2010 and December 31 2009 by relative risk class (low, medium and high) based
on the relative scores of the accounts within each class. A fourth class is shown for accounts that are not scored. The degree of risk,
as defined by the third party, refers to the likelihood that an account in the next 12 month period may become delinquent. Absence of
a score is not indicative of the credit quality of the account.
xLow risk accounts are companies with very good credit risk
xMedium risk accounts are companies with average to good credit risk
xHigh risk accounts are companies with poor credit risk, are delinquent, or are at risk of becoming delinquent
Although the relative score of accounts within each class is used as a factor for determining the establishment of a customer credit
limit, it is not indicative of our actual history of losses due to the business essential nature of our products and services.
The aging schedule included above, showing approximately 1.9% of the portfolio as greater than 90 days past due, and the roll-
forward schedule of the allowance for credit losses, showing the actual history of losses for the three most recent years ended
December 31, 2010 are more representative of the potential loss performance of our portfolio than relative risk based on scores, as
defined by the third party.
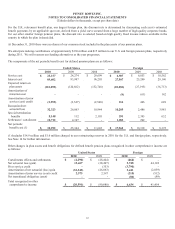
December 31, 2010
U.S. International Total U.S.
Inter-
national Total
Sales-type lease receivables
Risk Level
Low $ 1,001,663 $ 190,018 $1,191,681 60.0% 25.5% 49.3%
Medium 443,139 69,280 512,419 26.5% 9.3% 21.2%
High 49,183 11,572 60,755 2.9% 1.6% 2.5%
Not Scored 175,978 474,895 650,873 10.5% 63.7% 26.9%
Total $ 1,669,963 $ 745,765 $2,415,728 100% 100% 100%
Loan receivables
Risk Level
Low $ 21,808 $ 12,002 $ 33,810 5.0% 21.7% 6.9%
Medium 260,708 7,640 268,348 60.3% 13.8% 55.0%
High 147,975 1,406 149,381 34.2% 2.5% 30.6%
Not Scored 1,646 34,370 36,016 0.4% 62.0% 7.4%
Total $ 432,137 $ 55,418 $ 487,555 100% 100% 100%
Total
Risk Level
Low $ 1,023,471 $202,020 $1,225,491 48.7% 25.2% 42.2%
Medium 703,847 76,920 780,767 33.5% 9.6% 26.9%
High 197,158 12,978 210,136 9.4% 1.6% 7.2%
Not Scored 177,624 509,265 686,889 8.4% 63.6% 23.7%
Total $ 2,102,100 $801,183 $2,903,283 100% 100% 100%