Pitney Bowes 2010 Annual Report Download - page 74
Download and view the complete annual report
Please find page 74 of the 2010 Pitney Bowes annual report below. You can navigate through the pages in the report by either clicking on the pages listed below, or by using the keyword search tool below to find specific information within the annual report.-
 1
1 -
2
-
3
-
4
-
5
-
6
-
7
-
8
-
9
-
10
-
11
-
12
-
13
-
14
-
15
-
16
-
17
-
18
-
19
-
20
-
21
-
22
-
23
-
24
-
25
-
26
-
27
-
28
-
29
-
30
-
31
-
32
-
33
-
34
-
35
-
36
-
37
-
38
-
39
-
40
-
41
-
42
-
43
-
44
-
45
-
46
-
47
-
48
-
49
-
50
-
51
-
52
-
53
-
54
-
55
-
56
-
57
-
58
-
59
-
60
-
61
-
62
-
63
-
 64
64 -
 65
65 -
 66
66 -
 67
67 -
 68
68 -
 69
69 -
 70
70 -
 71
71 -
 72
72 -
 73
73 -
 74
74 -
 75
75 -
 76
76 -
 77
77 -
 78
78 -
 79
79 -
 80
80 -
 81
81 -
 82
82 -
 83
83 -
 84
84 -
85
-
86
-
87
-
88
-
89
-
90
-
91
-
92
-
93
-
94
-
95
-
96
-
97
-
98
-
99
-
100
-
101
-
102
-
103
-
104
-
105
-
106
-
107
-
108
-
109
-
110
-
111
-
112
-
113
-
114
-
115
-
116
-
117
-
118
-
119
-
120
-
121
-
122
-
123
-
124
-
125
-
126
 |
 |

PITNEY BOWES INC.
NOTES TO CONSOLIDATED FINANCIAL STATEMENTS
(Tabular dollars in thousands, except per share data)
55
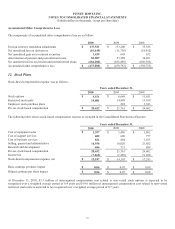
The items accounting for the difference between income taxes computed at the federal statutory rate and our provision for income
taxes consist of the following:
2010 2009 2008
Federal statutory provision $ 187,103 $ 242,612 $ 249,612
State and local income taxes 5,853 11,109 19,820
Impact of foreign operations 13,938 (18,037) 1,955
Tax exempt income/reimbursement (2,352) (2,748) (5,404)
Federal income tax credits/incentives (7,580) (4,792) (15,118)
Unrealized stock compensation benefits 15,149 12,852 -
Certain leasing transactions - - (9,550)
U.S. health care reform tax change 9,070 - -
Outside basis differences (15,798) - -
Other, net 387 (842) 3,614
Provision for income taxes $ 205,770 $ 240,154 $ 244,929
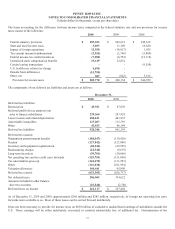
The components of our deferred tax liabilities and assets are as follows:
December 31,
2010 2009
Deferred tax liabilities:
Depreciation $ 49,351 $ 67,639
Deferred profit (for tax purposes) on
sales to finance subsidiaries 229,364 287,928
Lease revenue and related depreciation 480,611 443,855
Amortizable intangibles 117,207 115,793
Other 43,813 46,144
Deferred tax liabilities 920,346 961,359
Deferred tax (assets):
Nonpension postretirement benefits (104,847) (119,420)
Pension (127,042) (127,046)
Inventory and equipment capitalization (28,546) (29,595)
Restructuring charges (22,348) (9,619)
Long-term incentives (39,781) (50,666)
Net operating loss and tax credit carry forwards (153,754) (151,094)
Tax uncertainties gross-up (144,672) (133,293)
Other (116,834) (101,994)
Valuation allowance 104,441 95,990
Deferred tax (assets) (633,383) (626,737)
Net deferred taxes 286,963 334,622
Amounts included in other balance
sheet tax accounts (25,846) 12,780
Deferred taxes on income $ 261,117 $ 347,402
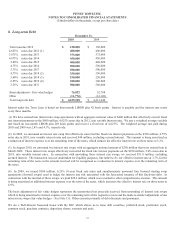
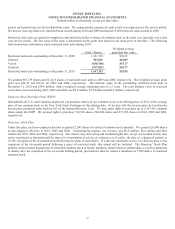
As of December 31, 2010 and 2009, approximately $266 million and $285 million, respectively, of foreign net operating loss carry
forwards were available to us. Most of these losses can be carried forward indefinitely.
It has not been necessary to provide for income taxes on $850 million of cumulative undistributed earnings of subsidiaries outside the
U.S. These earnings will be either indefinitely reinvested or remitted substantially free of additional tax. Determination of the