Pitney Bowes 2010 Annual Report Download - page 15
Download and view the complete annual report
Please find page 15 of the 2010 Pitney Bowes annual report below. You can navigate through the pages in the report by either clicking on the pages listed below, or by using the keyword search tool below to find specific information within the annual report.-
 1
1 -
2
-
3
-
4
-
 5
5 -
 6
6 -
 7
7 -
 8
8 -
 9
9 -
 10
10 -
 11
11 -
 12
12 -
 13
13 -
 14
14 -
 15
15 -
 16
16 -
 17
17 -
 18
18 -
 19
19 -
 20
20 -
 21
21 -
 22
22 -
 23
23 -
 24
24 -
 25
25 -
26
-
27
-
28
-
29
-
30
-
31
-
32
-
33
-
34
-
35
-
36
-
37
-
38
-
39
-
40
-
41
-
42
-
43
-
44
-
45
-
46
-
47
-
48
-
49
-
50
-
51
-
52
-
53
-
54
-
55
-
56
-
57
-
58
-
59
-
60
-
61
-
62
-
63
-
64
-
65
-
66
-
67
-
68
-
69
-
70
-
71
-
72
-
73
-
74
-
75
-
76
-
77
-
78
-
79
-
80
-
81
-
82
-
83
-
84
-
85
-
86
-
87
-
88
-
89
-
90
-
91
-
92
-
93
-
94
-
95
-
96
-
97
-
98
-
99
-
100
-
101
-
102
-
103
-
104
-
105
-
106
-
107
-
108
-
109
-
110
-
111
-
112
-
113
-
114
-
115
-
116
-
117
-
118
-
119
-
120
-
121
-
122
-
123
-
124
-
125
-
126
 |
 |

Pitney Bowes Annual Report 2010 13
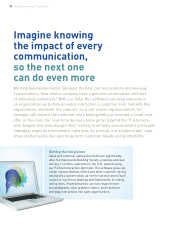
This annual report showcases how Pitney Bowes is helping companies grow by connecting with their customers
in more personalized, engaging ways. We believe that customer communications management presents the best
opportunities for sustained growth and value creation by leveraging our historical strengths in physical communications
and our emerging capabilities in digital communications.
In 2010, we laid the foundation for taking advantage of these opportunities by transforming our operations, processes
and cost structure, and the ways we will deliver market value going forward. In May we presented a view of our business
focused on the specifi c attributes and requirements of each of our customer segments. This included differentiated
market realities, growth prospects and investment requirements for both our Small and Medium Business (SMB) and
our Enterprise customer groups.
As part of the Strategic Transformation Program, discussed in this letter in 2009, we took decisive actions to drive
effi ciencies, build new capabilities and support growth opportunities. These actions enabled us to navigate the uneven
global business climate, while continuing to create capacity to invest in the business. The growing benefi ts from our
transformation and increased market demand for our mailing and production mail equipment, software and mail
services helped anchor the improving trends that emerged across both the SMB and Enterprise customer groups in
the second half of the year.
The swift and disciplined implementation of our plans also allowed us to identify opportunities for incremental
transformation. This enabled us to achieve $120 million of benefi ts from the program, net of system and related
investments, signifi cantly exceeding our original target of $50 million in net benefi ts for 2010. We are now projecting
that by 2012 net annualized benefi ts from our Strategic Transformation initiatives will exceed our original estimate
by $100 million, resulting in a range of benefi ts of $250 million to $300 million on a pretax basis. We are on track
to deliver these increased benefi ts, while the pretax costs associated with this program remain within our original
projected range. We have narrowed the range of expected program costs to $300 million to $350 million, as we have
completed more of the planned actions.
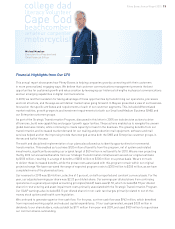
Our revenue for 2010 was $5.4 billion, a decline of 3 percent, on both a reported and constant currency basis. For the
year, our adjusted earnings per share was $2.23 per diluted share. Our earnings per diluted share from continuing
operations on a generally accepted accounting principles (GAAP) basis was $1.50, which included $0.59 per diluted
share for restructuring and asset impairment costs primarily associated with the Strategic Transformation Program.
Our GAAP earnings also included $0.13 per diluted share for non-cash tax charges primarily related to out-of-the-
money stock options and health care legislation.
We continued to generate superior free cash fl ow. For the year, our free cash fl ow was $962 million, which benefi ted
from improved working capital and reduced capital expenditures. Of our cash generated, we paid $320 million in
dividends to our shareholders, reduced debt by $171 million from year-end 2009, and used $100 million to repurchase
our common shares outstanding.
Financial Highlights from Our CFO
college dad
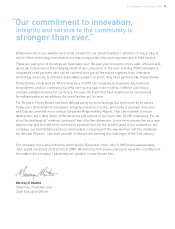
Michael Monahan
Executive Vice President and
Chief Financial Officer
amateur carpenter
beachcomber
literacy volunteer
motorcyclist