Pitney Bowes 2010 Annual Report Download - page 69
Download and view the complete annual report
Please find page 69 of the 2010 Pitney Bowes annual report below. You can navigate through the pages in the report by either clicking on the pages listed below, or by using the keyword search tool below to find specific information within the annual report.-
 1
1 -
2
-
3
-
4
-
5
-
6
-
7
-
8
-
9
-
10
-
11
-
12
-
13
-
14
-
15
-
16
-
17
-
18
-
19
-
20
-
21
-
22
-
23
-
24
-
25
-
26
-
27
-
28
-
29
-
30
-
31
-
32
-
33
-
34
-
35
-
36
-
37
-
38
-
39
-
40
-
41
-
42
-
43
-
44
-
45
-
46
-
47
-
48
-
49
-
50
-
51
-
52
-
53
-
54
-
55
-
56
-
57
-
58
-
 59
59 -
 60
60 -
 61
61 -
 62
62 -
 63
63 -
 64
64 -
 65
65 -
 66
66 -
 67
67 -
 68
68 -
 69
69 -
 70
70 -
 71
71 -
 72
72 -
 73
73 -
 74
74 -
 75
75 -
 76
76 -
 77
77 -
 78
78 -
 79
79 -
80
-
81
-
82
-
83
-
84
-
85
-
86
-
87
-
88
-
89
-
90
-
91
-
92
-
93
-
94
-
95
-
96
-
97
-
98
-
99
-
100
-
101
-
102
-
103
-
104
-
105
-
106
-
107
-
108
-
109
-
110
-
111
-
112
-
113
-
114
-
115
-
116
-
117
-
118
-
119
-
120
-
121
-
122
-
123
-
124
-
125
-
126
 |
 |
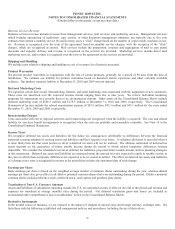
PITNEY BOWES INC.
NOTES TO CONSOLIDATED FINANCIAL STATEMENTS
(Tabular dollars in thousands, except per share data)
50
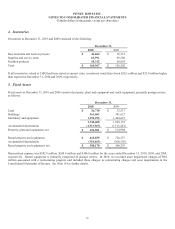
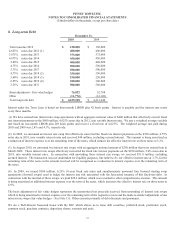
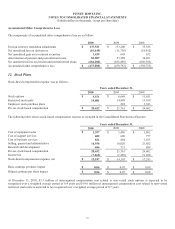
6. Intangible Assets and Goodwill
The components of our purchased intangible assets are as follows:
December 31, 2010 December 31, 2009
Gross
Carrying
Amount
Accumulated
Amortization
Net
Carrying
Amount
Gross
Carrying
Amount
Accumulated
Amortization
Net
Carrying
Amount
Customer relationships $ 453,523 $ (229,143) $ 224,380 $ 428,888 $ (197,497) $ 231,391
Supplier relationships 29,000 (16,192) 12,808 29,000 (13,292) 15,708
Mailing software
and technology 172,188 (118,390) 53,798 164,211 (103,388) 60,823
Trademarks
and trade names 36,322 (30,224) 6,098 35,855 (27,898) 7,957
Non-compete
agreements 7,845 (7,486) 359 7,753 (7,215) 538
$ 698,878 $ (401,435) $ 297,443 $ 665,707 $ (349,290) $ 316,417
Amortization expense for intangible assets was $60.8 million, $69.1 million and $72.3 million for the years ended December 31, 2010,
2009 and 2008, respectively. The future amortization expense related to intangible assets as of December 31, 2010 is as follows:
Year ended December 31, Amount
2011 $ 58,865
2012 50,983
2013 47,343
2014 42,191
2015 35,044
Thereafter 63,017
$ 297,443
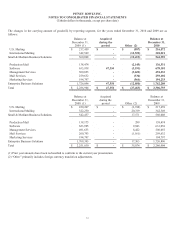
Actual amortization expense may differ from the amounts above due to, among other things, future acquisitions, impairments of
intangible assets, accelerated amortization and changes in foreign currency exchange rates.
In 2010, we recorded impairment charges of $4.7 million and included these charges in restructuring charges and asset impairments in
the Consolidated Statements of Income. See Note 14 for further details.
Intangible assets acquired during 2010 are shown in the table below. There were no additions in 2009.
December 31, 2010
Amount
Weighted
Average
Life
Customer relationships $ 36,763 11 years
Mailing software and technology 13,954 6 years
Trademarks and trade names 1,125 6 years
Non-compete agreements 110 5 years
$ 51,952 10 years