Pitney Bowes 2010 Annual Report Download - page 101
Download and view the complete annual report
Please find page 101 of the 2010 Pitney Bowes annual report below. You can navigate through the pages in the report by either clicking on the pages listed below, or by using the keyword search tool below to find specific information within the annual report.-
 1
1 -
2
-
3
-
4
-
5
-
6
-
7
-
8
-
9
-
10
-
11
-
12
-
13
-
14
-
15
-
16
-
17
-
18
-
19
-
20
-
21
-
22
-
23
-
24
-
25
-
26
-
27
-
28
-
29
-
30
-
31
-
32
-
33
-
34
-
35
-
36
-
37
-
38
-
39
-
40
-
41
-
42
-
43
-
44
-
45
-
46
-
47
-
48
-
49
-
50
-
51
-
52
-
53
-
54
-
55
-
56
-
57
-
58
-
59
-
60
-
61
-
62
-
63
-
64
-
65
-
66
-
67
-
68
-
69
-
70
-
71
-
72
-
73
-
74
-
75
-
76
-
77
-
78
-
79
-
80
-
81
-
82
-
83
-
84
-
85
-
86
-
87
-
88
-
89
-
90
-
 91
91 -
 92
92 -
 93
93 -
 94
94 -
 95
95 -
 96
96 -
 97
97 -
 98
98 -
 99
99 -
 100
100 -
 101
101 -
 102
102 -
 103
103 -
 104
104 -
 105
105 -
 106
106 -
 107
107 -
 108
108 -
 109
109 -
 110
110 -
 111
111 -
112
-
113
-
114
-
115
-
116
-
117
-
118
-
119
-
120
-
121
-
122
-
123
-
124
-
125
-
126
 |
 |

PITNEY BOWES INC.
NOTES TO CONSOLIDATED FINANCIAL STATEMENTS
(Tabular dollars in thousands, except per share data)
82
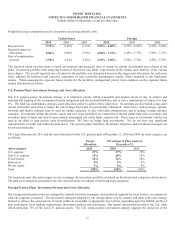
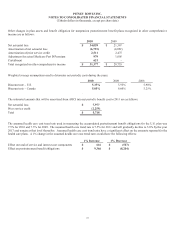
For the U.K. retirement benefit plan, our largest foreign plan, the discount rate is determined by discounting each year’s estimated
benefit payments by an applicable spot rate, derived from a yield curve created from a large number of high quality corporate bonds.
For our other smaller foreign pension plans, the discount rate is selected based on high quality fixed income indices available in the
country in which the plan is domiciled.
At December 31, 2010 there were no shares of our common stock included in the plan assets of our pension plans.
We anticipate making contributions of approximately $130 million and $15 million to our U.S. and foreign pension plans, respectively
during 2011. We will reassess our funding alternatives as the year progresses.
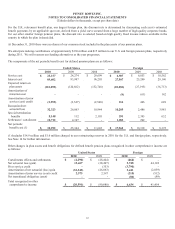
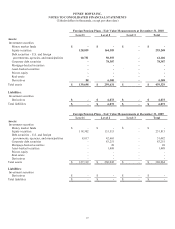
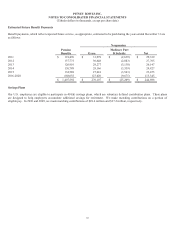
The components of the net periodic benefit cost for defined pension plans are as follows:
United States Foreign
2010 2009 2008 2010 2009 2008
Service cost $ 23,157 $ 24,274 $ 29,699 $ 6,907 $ 6,853 $ 10,562
Interest cost 89,602 93,997 96,205 27,507 25,200 29,140
Expected return on
plan assets (123,095) (120,662) (132,748)
(28,838)
(27,193)
(36,713)
Amortization of
transition cost - - - (9) (61) 142
Amortization of prior
service (cost) credit (2,555) (2,547) (2,560) 214 446 628
Recognized net
actuarial loss 32,323 26,063 18,944 10,205 2,486 3,981
Special termination
benefits 8,148 112 2,105 291 2,385 632
Settlement / curtailment 10,712 4,107 - 1,285 202 -
Net periodic
benefit cost (1) $ 38,292 $ 25,344 $ 11,645 $ 17,562 $ 10,318 $ 8,372
(1) Includes $14.9 million and $1.6 million charged to our restructuring reserves in 2010 for the U.S. and foreign plans, respectively.
See Note 14 for further information.
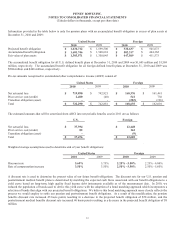
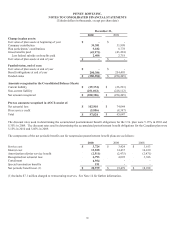
Other changes in plan assets and benefit obligations for defined benefit pension plans recognized in other comprehensive income are
as follows:
United States Foreign
2010 2009 2010 2009
Curtailments effects and settlements $ (4,290) $ (28,404) $ (464) $ -
Net actuarial loss (gain) 13,467 (38,407) 5,748 44,124
Prior service credit - (353) (3,790) -
Amortization of net actuarial (loss) gain (32,343) (26,063) 5,441 (2,059)
Amortization of prior service (cost) credit 2,575 2,547 (215) (512)
Net transitional obligation (asset) - - (86) (99)
Total recognized in other
comprehensive income $ (20,591) $ (90,680) $ 6,634 $ 41,454