Pitney Bowes 2010 Annual Report Download - page 33
Download and view the complete annual report
Please find page 33 of the 2010 Pitney Bowes annual report below. You can navigate through the pages in the report by either clicking on the pages listed below, or by using the keyword search tool below to find specific information within the annual report.-
 1
1 -
2
-
3
-
4
-
5
-
6
-
7
-
8
-
9
-
10
-
11
-
12
-
13
-
14
-
15
-
16
-
17
-
18
-
19
-
20
-
21
-
22
-
 23
23 -
 24
24 -
 25
25 -
 26
26 -
 27
27 -
 28
28 -
 29
29 -
 30
30 -
 31
31 -
 32
32 -
 33
33 -
 34
34 -
 35
35 -
 36
36 -
 37
37 -
 38
38 -
 39
39 -
 40
40 -
 41
41 -
 42
42 -
 43
43 -
44
-
45
-
46
-
47
-
48
-
49
-
50
-
51
-
52
-
53
-
54
-
55
-
56
-
57
-
58
-
59
-
60
-
61
-
62
-
63
-
64
-
65
-
66
-
67
-
68
-
69
-
70
-
71
-
72
-
73
-
74
-
75
-
76
-
77
-
78
-
79
-
80
-
81
-
82
-
83
-
84
-
85
-
86
-
87
-
88
-
89
-
90
-
91
-
92
-
93
-
94
-
95
-
96
-
97
-
98
-
99
-
100
-
101
-
102
-
103
-
104
-
105
-
106
-
107
-
108
-
109
-
110
-
111
-
112
-
113
-
114
-
115
-
116
-
117
-
118
-
119
-
120
-
121
-
122
-
123
-
124
-
125
-
126
 |
 |

14
economic uncertainty. EBIT increased 18% to $61 million compared to last year due to the higher revenue and our initiatives to
improve productivity and consolidate administrative functions. Foreign currency translation had a 1% favorable impact on EBIT.
Software revenue increased 5% over last year to $363 million, driven by the acquisition of Portrait Software (4%) and the favorable
impact of foreign currency translation (1%). We continue to build more recurring revenue streams through multi-year licensing
agreements, which have the effect of deferring some revenue to future periods. EBIT increased 13% over last year to $42 million due
to business integration and productivity initiatives. EBIT was negatively impacted by transaction-related fees of approximately $2
million associated with the Portrait acquisition. Foreign currency translation had a less than 1% favorable impact on EBIT.
Management Services revenue decreased 6% compared to last year to $999 million due the loss of several large postal contracts and
decreased print volumes. Despite the lower revenues, EBIT increased 28% over the prior year to $93 million primarily due to our
actions to align costs with changing volumes through a more variable cost infrastructure, ongoing productivity initiatives and a focus
on more profitable contracts. Foreign currency translation had a less than 1% impact on both revenue and EBIT.
Mail Services revenue increased 1% compared to last year to $562 million, while EBIT decreased 23% to $63 million. Mail Services
revenue and EBIT were adversely impacted by $21 million and $16 million, respectively, due to a one-time out of period adjustment
in the International Mail Services portion of the business primarily related to the correction to the rates used to estimate earned but
unbilled revenue for the periods 2007 through the first quarter of 2010. The impact of this adjustment was not material on any
individual quarter or year during these periods. Excluding the impact of this adjustment, revenue increased 4% over the prior year, but
EBIT decreased 5%. The revenue increase was driven partially by increased volumes of presort mail and Standard Class mail
processed and acquisitions (2%). The decrease in EBIT was driven by higher shipping rates charged by international carriers for our
International Mail Services business, which more than offset the favorable margin impacts in our Presort business.
Marketing Services revenue of $142 million was flat compared to the prior year. Revenue was impacted by increased vendor
advertising for Movers’ Source kits offset by a decline in household moves compared to prior year. EBIT increased 14% over last
year due to more profitable vendor revenue per transaction.
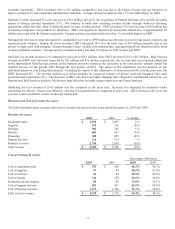
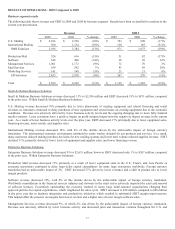
Revenues and Cost of revenues by source
The following tables show revenues and costs of revenues by source for the years ended December 31, 2010 and 2009:
Revenues by source
2010 2009 % change
Equipment sales $1,030 $1,007 2 %
Supplies 318 336 (5)%
Software 382 365 5 %
Rentals 601 647 (7)%
Financing 638 695 (8)%
Support services 712 714 - %
Business services 1,744 1,805 (3)%
Total revenue $5,425 $5,569 (3)%
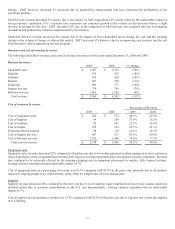
Cost of revenues by source
Percentage of Revenue
2010 2009 2010 2009
Cost of equipment sales $476 $456 46.2% 45.3%
Cost of supplies 97 94 30.5% 27.9%
Cost of software 86 82 22.5% 22.5%
Cost of rentals 142 159 23.6% 24.5%
Financing interest expense 88 98 13.8% 14.1%
Cost of support services 452 467 63.5% 65.4%
Cost of business services 1,337 1,382 76.7% 76.6%
Total cost of revenues $2,678 $2,738 49.4% 49.2%