Pitney Bowes 2010 Annual Report Download - page 94
Download and view the complete annual report
Please find page 94 of the 2010 Pitney Bowes annual report below. You can navigate through the pages in the report by either clicking on the pages listed below, or by using the keyword search tool below to find specific information within the annual report.-
 1
1 -
2
-
3
-
4
-
5
-
6
-
7
-
8
-
9
-
10
-
11
-
12
-
13
-
14
-
15
-
16
-
17
-
18
-
19
-
20
-
21
-
22
-
23
-
24
-
25
-
26
-
27
-
28
-
29
-
30
-
31
-
32
-
33
-
34
-
35
-
36
-
37
-
38
-
39
-
40
-
41
-
42
-
43
-
44
-
45
-
46
-
47
-
48
-
49
-
50
-
51
-
52
-
53
-
54
-
55
-
56
-
57
-
58
-
59
-
60
-
61
-
62
-
63
-
64
-
65
-
66
-
67
-
68
-
69
-
70
-
71
-
72
-
73
-
74
-
75
-
76
-
77
-
78
-
79
-
80
-
81
-
82
-
83
-
 84
84 -
 85
85 -
 86
86 -
 87
87 -
 88
88 -
 89
89 -
 90
90 -
 91
91 -
 92
92 -
 93
93 -
 94
94 -
 95
95 -
 96
96 -
 97
97 -
 98
98 -
 99
99 -
 100
100 -
 101
101 -
 102
102 -
 103
103 -
 104
104 -
105
-
106
-
107
-
108
-
109
-
110
-
111
-
112
-
113
-
114
-
115
-
116
-
117
-
118
-
119
-
120
-
121
-
122
-
123
-
124
-
125
-
126
 |
 |

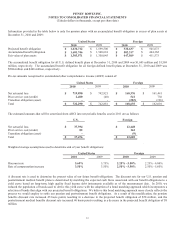
PITNEY BOWES INC.
NOTES TO CONSOLIDATED FINANCIAL STATEMENTS
(Tabular dollars in thousands, except per share data)
75
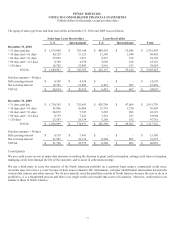
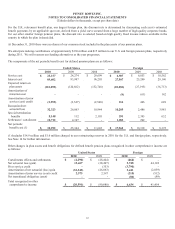
December 31, 2009
U.S. International Total U.S.
Inter-
national Total
Sales-type lease receivables
Risk Level
Low $ 1,142,945 $ 207,214 $ 1,350,159 62.2% 26.7% 51.7%
Medium 466,616 89,606 556,222 25.4% 11.6% 21.3%
High 51,211 3,042 54,253 2.8% 0.4% 2.1%
Not Scored 176,127 475,109 651,236 9.6% 61.3% 24.9%
Total $ 1,836,899 $ 774,971 $ 2,611,870 100% 100% 100%
Loan receivables
Risk Level
Low $ 20,688 $ 10,382 $31,070 4.5% 20.9% 6.1%
Medium 288,062 5,675 293,737 63.1% 11.5% 58.1%
High 147,558 201 147,759 32.3% 0.4% 29.2%
Not Scored - 33,305 33,305 0.0% 67.2% 6.6%
Total $ 456,308 $ 49,563 $ 505,871 100% 100% 100%
Total
Risk Level
Low $ 1,163,633 $ 217,596 $1,381,229 50.7% 26.4% 44.3%
Medium 754,678 95,281 849,959 32.9% 11.6% 27.3%
High 198,769 3,243 202,012 8.7% 0.4% 6.5%
Not Scored 176,127 508,414 684,541 7.7% 61.7% 22.0%
Total $ 2,293,207 $ 824,534 $3,117,741 100% 100% 100%
Pitney Bowes Bank
At December 31, 2010, PBB had assets of $675 million and liabilities of $626 million. The bank’s assets consist of finance
receivables, short and long-term investments and cash. PBB’s key product offering, Purchase Power, is a revolving credit solution,
which enables customers to finance their postage costs when they refill their meter. PBB earns revenue through transaction fees,
finance charges on outstanding balances, and other fees for services. The bank’s liabilities consist primarily of PBB’s deposit
solution, Reserve Account, which provides value to large-volume mailers who prefer to prepay postage and earn interest on their
deposits. PBB is regulated by the Federal Deposit Insurance Corporation (FDIC) and the Utah Department of Financial Institutions.
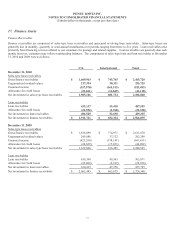
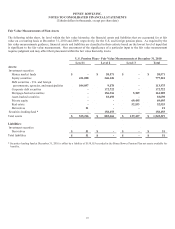
Leveraged Leases
Our investment in leveraged lease assets consists of the following:
December 31,
2010 2009
Rental receivables $ 1,802,107 $ 1,747,811
Unguaranteed residual values 14,141 13,399
Principal and interest on non-recourse loans (1,373,651) (1,341,820)
Unearned income (191,591) (186,031)
Investment in leveraged leases 251,006 233,359
Less: deferred taxes related to leveraged leases (192,128) (175,329)
Net investment in leveraged leases $ 58,878 $ 58,030