Pitney Bowes 2010 Annual Report Download - page 91
Download and view the complete annual report
Please find page 91 of the 2010 Pitney Bowes annual report below. You can navigate through the pages in the report by either clicking on the pages listed below, or by using the keyword search tool below to find specific information within the annual report.-
 1
1 -
2
-
3
-
4
-
5
-
6
-
7
-
8
-
9
-
10
-
11
-
12
-
13
-
14
-
15
-
16
-
17
-
18
-
19
-
20
-
21
-
22
-
23
-
24
-
25
-
26
-
27
-
28
-
29
-
30
-
31
-
32
-
33
-
34
-
35
-
36
-
37
-
38
-
39
-
40
-
41
-
42
-
43
-
44
-
45
-
46
-
47
-
48
-
49
-
50
-
51
-
52
-
53
-
54
-
55
-
56
-
57
-
58
-
59
-
60
-
61
-
62
-
63
-
64
-
65
-
66
-
67
-
68
-
69
-
70
-
71
-
72
-
73
-
74
-
75
-
76
-
77
-
78
-
79
-
80
-
 81
81 -
 82
82 -
 83
83 -
 84
84 -
 85
85 -
 86
86 -
 87
87 -
 88
88 -
 89
89 -
 90
90 -
 91
91 -
 92
92 -
 93
93 -
 94
94 -
 95
95 -
 96
96 -
 97
97 -
 98
98 -
 99
99 -
 100
100 -
 101
101 -
102
-
103
-
104
-
105
-
106
-
107
-
108
-
109
-
110
-
111
-
112
-
113
-
114
-
115
-
116
-
117
-
118
-
119
-
120
-
121
-
122
-
123
-
124
-
125
-
126
 |
 |

PITNEY BOWES INC.
NOTES TO CONSOLIDATED FINANCIAL STATEMENTS
(Tabular dollars in thousands, except per share data)
72
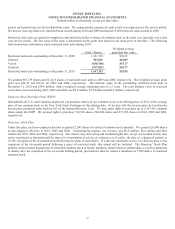
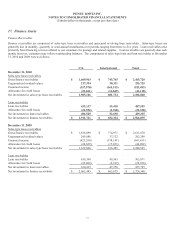
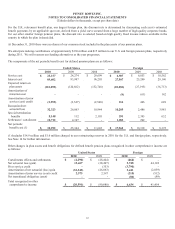
Maturities of gross sales-type lease and loan receivables at December 31, 2010 were as follows:
Sales-type Lease Receivables Loan Receivables
U.S. International Total U.S. International Total
2011 $ 723,567 $ 233,509 $ 957,076 $
432,137 $ 55,418 $
487,555
2012 461,222 191,822 653,044 - - -
2013 291,280 156,570 447,850 - - -
2014 147,509 118,566 266,075 - - -
2015 41,614 40,649 82,263 - - -
Thereafter 4,771 4,649 9,420 - - -
Total $
1,669,963 $ 745,765 $
2,415,728 $
432,137 $ 55,418 $
487,555
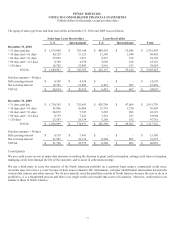
Activity in the allowance for credit losses for sales-type lease and loan receivables for each of the three years ended December 31,
2010, 2009 and 2008 is as follows:
Allowance for Credit Losses
Sales-type Lease Receivables Loan Receivables
U.S. International U.S. International Total
Balance January 1, 2008 $ 31,173 $ 21,384 $ 23,110 $ 2,704 $ 78,371
Amounts charged to expense 10,015 6,592 32,117 3,012 51,736
Accounts written off (14,481) (11,269) (29,782) (2,785) (58,317)
Balance December 31, 2008 26,707 16,707 25,445 2,931 71,790
Amounts charged to expense 15,304 12,437 31,894 2,120 61,755
Accounts written off (15,382) (11,691) (31,450) (2,864) (61,387)
Balance December 31, 2009 26,629 17,453 25,889 2,187 72,158
Amounts charged to expense 12,076 7,854 19,360 2,710 42,000
Accounts written off (14,444) (8,458) (19,697) (2,129) (44,728)
Balance December 31, 2010 $ 24,261 $ 16,849 $ 25,552 $ 2,768 $ 69,430