Pitney Bowes 2010 Annual Report Download - page 87
Download and view the complete annual report
Please find page 87 of the 2010 Pitney Bowes annual report below. You can navigate through the pages in the report by either clicking on the pages listed below, or by using the keyword search tool below to find specific information within the annual report.-
 1
1 -
2
-
3
-
4
-
5
-
6
-
7
-
8
-
9
-
10
-
11
-
12
-
13
-
14
-
15
-
16
-
17
-
18
-
19
-
20
-
21
-
22
-
23
-
24
-
25
-
26
-
27
-
28
-
29
-
30
-
31
-
32
-
33
-
34
-
35
-
36
-
37
-
38
-
39
-
40
-
41
-
42
-
43
-
44
-
45
-
46
-
47
-
48
-
49
-
50
-
51
-
52
-
53
-
54
-
55
-
56
-
57
-
58
-
59
-
60
-
61
-
62
-
63
-
64
-
65
-
66
-
67
-
68
-
69
-
70
-
71
-
72
-
73
-
74
-
75
-
76
-
 77
77 -
 78
78 -
 79
79 -
 80
80 -
 81
81 -
 82
82 -
 83
83 -
 84
84 -
 85
85 -
 86
86 -
 87
87 -
 88
88 -
 89
89 -
 90
90 -
 91
91 -
 92
92 -
 93
93 -
 94
94 -
 95
95 -
 96
96 -
 97
97 -
98
-
99
-
100
-
101
-
102
-
103
-
104
-
105
-
106
-
107
-
108
-
109
-
110
-
111
-
112
-
113
-
114
-
115
-
116
-
117
-
118
-
119
-
120
-
121
-
122
-
123
-
124
-
125
-
126
 |
 |

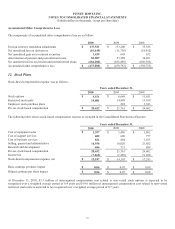
PITNEY BOWES INC.
NOTES TO CONSOLIDATED FINANCIAL STATEMENTS
(Tabular dollars in thousands, except per share data)
68
The fair value of long-term debt is estimated based on quoted market prices for the identical issue when traded in an active market.
When a quoted market price is not available, the fair value is determined using rates currently available to the company for debt with
similar terms and remaining maturities.
14. Restructuring Charges and Asset Impairments
2009 Program
In 2009, we announced that we were undertaking a series of initiatives designed to transform and enhance the way we operate as a
global company. In order to enhance our responsiveness to changing market conditions, we are executing a strategic transformation
program designed to create improved processes and systems to further enable us to invest in future growth in areas such as our global
customer interactions and product development processes. This program is expected to continue into 2012 and will result in the
reduction of 10 percent of the positions in the company. Total pre-tax costs of this program are expected to be between $300 million
to $350 million primarily related to severance and benefit costs, including pension and retiree medical charges, incurred in connection
with such workforce reductions. Most of the total pre-tax costs will be cash-related charges. Currently, we are targeting annualized
pre-tax benefits, net of system and related investments, in the range of $250 million to $300 million by 2012. These costs and the
related benefits will be recognized as different actions are approved and implemented.
During 2010, we recorded pre-tax restructuring and asset impairment charges of 183.0 million, which included $115.6 million for
employee severance and benefits costs, a $23.6 million pension and retiree medical charge as workforce reductions caused the
elimination of a significant amount of future service requiring us to recognize a portion of the prior service costs and actuarial losses
and other exit costs of $38.2 million. Asset impairment charges of $14.5 million include $9.8 million fixed asset write-offs associated
with the restructuring program and $4.7 million impairment of certain intangible assets unrelated to the restructuring program. The
cumulative charges for this program since inception through December 31, 2010 were $250 million. As of December 31, 2010,
approximately 2,000 employee terminations have occurred under this program. The majority of the liability at December 31, 2010 is
expected to be paid from cash generated from operations.
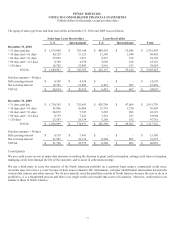
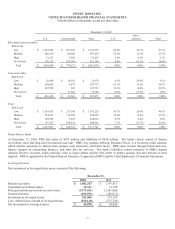
Activity in the reserves for the restructuring actions taken in connection with the 2009 Program and asset impairments for the years
ended December 31, 2010 and 2009 is as follows:
Severance
and benefits
costs
Pension
and Retiree
Medical
Asset
impairments,
net
Other exit
costs Total
Balance at January 1, 2009 $ - $ - $ - $ - $ -
Expenses 55,836 - 18 11,492 67,346
Cash payments (9,941) - - (4,685) (14,626)
Non-cash charges - - (18) - (18)
Balance at December 31, 2009 45,895 - - 6,807 52,702
Expenses 115,557 23,620 14,515 38,233 191,925
Gain on sale of facility (8,897) (8,897)
Cash (payments) receipts (73,283) - 8,897 (38,253) (102,639)
Non-cash charges - (23,620) (14,515) - (38,135)
Balance at December 31, 2010 $ 88,169 $ - $ - $ 6,787 $ 94,956
2007 Program
In 2007, we announced a program to lower our cost structure, accelerate efforts to improve operational efficiencies, and transition our
product line. The program included charges primarily associated with older equipment that we had stopped selling upon transition to
the new generation of fully digital, networked, and remotely-downloadable equipment.