Pitney Bowes 2010 Annual Report Download - page 86
Download and view the complete annual report
Please find page 86 of the 2010 Pitney Bowes annual report below. You can navigate through the pages in the report by either clicking on the pages listed below, or by using the keyword search tool below to find specific information within the annual report.-
 1
1 -
2
-
3
-
4
-
5
-
6
-
7
-
8
-
9
-
10
-
11
-
12
-
13
-
14
-
15
-
16
-
17
-
18
-
19
-
20
-
21
-
22
-
23
-
24
-
25
-
26
-
27
-
28
-
29
-
30
-
31
-
32
-
33
-
34
-
35
-
36
-
37
-
38
-
39
-
40
-
41
-
42
-
43
-
44
-
45
-
46
-
47
-
48
-
49
-
50
-
51
-
52
-
53
-
54
-
55
-
56
-
57
-
58
-
59
-
60
-
61
-
62
-
63
-
64
-
65
-
66
-
67
-
68
-
69
-
70
-
71
-
72
-
73
-
74
-
75
-
 76
76 -
 77
77 -
 78
78 -
 79
79 -
 80
80 -
 81
81 -
 82
82 -
 83
83 -
 84
84 -
 85
85 -
 86
86 -
 87
87 -
 88
88 -
 89
89 -
 90
90 -
 91
91 -
 92
92 -
 93
93 -
 94
94 -
 95
95 -
 96
96 -
97
-
98
-
99
-
100
-
101
-
102
-
103
-
104
-
105
-
106
-
107
-
108
-
109
-
110
-
111
-
112
-
113
-
114
-
115
-
116
-
117
-
118
-
119
-
120
-
121
-
122
-
123
-
124
-
125
-
126
 |
 |

PITNEY BOWES INC.
NOTES TO CONSOLIDATED FINANCIAL STATEMENTS
(Tabular dollars in thousands, except per share data)
67
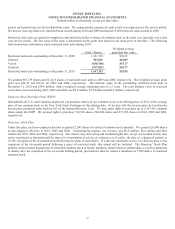
As of December 31, 2010, substantially all of the derivative loss recognized in accumulated other comprehensive income (AOCI) will
be recognized in earnings within the next 12 months. No amount of ineffectiveness was recorded in earnings for these designated cash
flow hedges for the years ended December 31, 2010 and 2009.
The following represents the results of cash flow hedging relationships for the years ended December 31, 2010 and 2009:
Derivative Gain (Loss)
Recognized in OCI
(Effective Portion)
Gain (Loss) Reclassified
from AOCI to Earnings
(Effective Portion)
Derivative Instrument 2010 2009
Location of Gain (Loss)
(Effective Portion) 2010 2009
Foreign exchange contracts $ (470) $ (658) Revenue $ 1,024 $-
Cost of sales (452) -
$ 572 $-
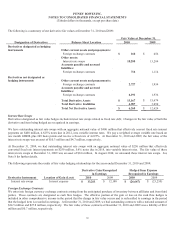
We also enter into foreign exchange contracts to minimize the impact of exchange rate fluctuations on short-term intercompany loans
and related interest that are denominated in a foreign currency. The revaluation of the intercompany loans and interest and the mark-
to-market on the derivatives are both recorded to earnings. At December 31, 2010, outstanding foreign exchange contracts to buy or
sell various currencies had a net liability value of $3.5 million. The contracts mature by March 31, 2011. At December 31, 2009, the
net liability value of these derivatives was less than $0.1 million.
The following represents the results of our non-designated derivative instruments for the years ended December 31, 2010 and 2009:
Derivative Gain (Loss)
Recognized in Earnings
Derivative Instrument Location of Derivative Gain (Loss) 2010 2009
Foreign exchange contracts Selling, general and administrative expense $ (22,158) $ (59,244)
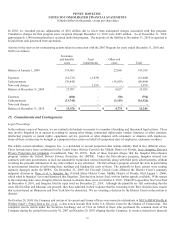
Credit-Risk-Related Contingent Features
Certain of our derivative instruments contain provisions that would require us to post collateral upon a significant downgrade in our
long-term senior unsecured debt ratings. At December 31, 2010, our long-term senior unsecured debt ratings were BBB+ / A2. Based
on derivative values at December 31, 2010, we would have been required to post $3.0 million in collateral if our long-term senior
unsecured debt ratings had fallen below BB- / Ba3.
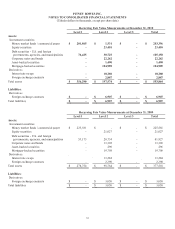
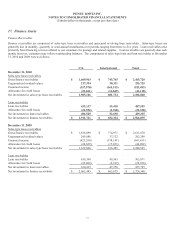
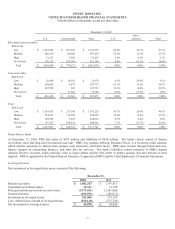
Fair Value of Financial Instruments
Our financial instruments include cash and cash equivalents, investment securities, accounts receivable, loans receivable, accounts
payable, notes payable, long-term debt and derivative instruments. The carrying value for cash, cash equivalents, accounts receivable,
accounts payable and notes payable approximate fair value because of the short maturity of these instruments.
The carrying values and estimated fair value of our remaining financial instruments at December 31, 2010 and 2009 was as follows:
December 31, 2010 December 31, 2009
Carrying
value (1)
Fair value
Carrying
value (1)
Fair value
Investment securities $ 538,562 $ 540,697 $ 360,800 $ 361,845
Loans receivable $ 459,499 $ 459,499 $ 478,191 $ 478,191
Derivatives, net $ 6,260 $ 6,260 $ 12,624 $ 12,624
Long-term debt $ (4,301,337) $ (4,388,923) $ (4,271,555) $ (4,409,961)
(1) Carrying value includes accrued interest and deferred fee income, where applicable.