Pitney Bowes 2010 Annual Report Download - page 84
Download and view the complete annual report
Please find page 84 of the 2010 Pitney Bowes annual report below. You can navigate through the pages in the report by either clicking on the pages listed below, or by using the keyword search tool below to find specific information within the annual report.-
 1
1 -
2
-
3
-
4
-
5
-
6
-
7
-
8
-
9
-
10
-
11
-
12
-
13
-
14
-
15
-
16
-
17
-
18
-
19
-
20
-
21
-
22
-
23
-
24
-
25
-
26
-
27
-
28
-
29
-
30
-
31
-
32
-
33
-
34
-
35
-
36
-
37
-
38
-
39
-
40
-
41
-
42
-
43
-
44
-
45
-
46
-
47
-
48
-
49
-
50
-
51
-
52
-
53
-
54
-
55
-
56
-
57
-
58
-
59
-
60
-
61
-
62
-
63
-
64
-
65
-
66
-
67
-
68
-
69
-
70
-
71
-
72
-
73
-
 74
74 -
 75
75 -
 76
76 -
 77
77 -
 78
78 -
 79
79 -
 80
80 -
 81
81 -
 82
82 -
 83
83 -
 84
84 -
 85
85 -
 86
86 -
 87
87 -
 88
88 -
 89
89 -
 90
90 -
 91
91 -
 92
92 -
 93
93 -
 94
94 -
95
-
96
-
97
-
98
-
99
-
100
-
101
-
102
-
103
-
104
-
105
-
106
-
107
-
108
-
109
-
110
-
111
-
112
-
113
-
114
-
115
-
116
-
117
-
118
-
119
-
120
-
121
-
122
-
123
-
124
-
125
-
126
 |
 |
PITNEY BOWES INC.
NOTES TO CONSOLIDATED FINANCIAL STATEMENTS
(Tabular dollars in thousands, except per share data)
65
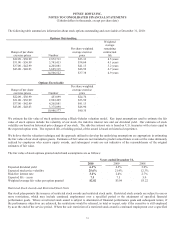
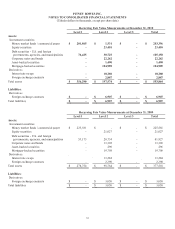
Investment Securities
For our investments, we use the market approach for recurring fair value measurements and the valuation techniques use inputs that
are observable, or can be corroborated by observable data, in an active marketplace. The following information relates to our
classification into the fair value hierarchy:
• Money Market Funds / Commercial Paper: Money market funds typically invest in government securities, certificates of deposit,
commercial paper of companies and other highly liquid and low-risk securities. Money market funds are principally used for
overnight deposits and are classified as Level 1 when unadjusted quoted prices in active markets are available and as Level 2
when they are not actively traded on an exchange. Direct investments in commercial paper are not listed on an exchange in an
active market and are classified as Level 2.
• Equity Securities: Equity securities are comprised of mutual funds investing in U.S. and foreign common stock. These mutual
funds are not separately listed on an exchange and are valued based on quoted market prices of similar securities. Accordingly,
these securities are classified as Level 2.
• Debt Securities – U.S. and Foreign Governments, Agencies and Municipalities: Debt securities are classified as Level 1 where
active, high volume trades for identical securities exist. Valuation adjustments are not applied to these securities. Debt securities
valued using quoted market prices for similar securities or benchmarking model derived prices to quoted market prices and trade
data for identical or comparable securities are classified as Level 2.
• Debt Securities – Corporate: Corporate debt securities are valued using recently executed transactions, market price quotations
where observable, or bond spreads. The spread data used are for the same maturity as the security. These securities are classified
as Level 2.
• Asset-Backed Securities (ABS) and Mortgage-Backed Securities (MBS): These securities are valued based on external pricing
indices. When external index pricing is not observable, ABS and MBS are valued based on external price/spread data. These
securities are classified as Level 2.
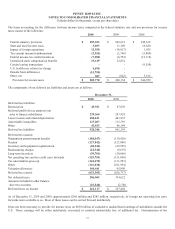
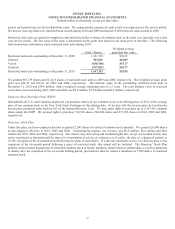
Investment securities include investments by The Pitney Bowes Bank (PBB). PBB is a wholly-owned subsidiary and a Utah-chartered
Industrial Loan Company (ILC). The bank’s investments at December 31, 2010 were $246.4 million and were reported in the
Consolidated Balance Sheets as cash and cash equivalents of $60.5 million, short-term investments of $27.2 million and long-term
investments, which are presented within other assets, of $158.7 million. The bank’s investments at December 31, 2009 were $222.4
million and were reported in the Consolidated Balance Sheets as cash and cash equivalents of $151.3 million, short-term investments
of $14.2 million and long-term investments, which are presented within other assets, of $56.9 million.
We have not experienced any other than temporary impairments in our investment portfolio. The majority of our MBS are guaranteed
by the U.S. government. Market events have not caused our money market funds to experience declines in their net asset value below
$1.00 per share or to impose limits on redemptions. We have no investments in inactive markets which would warrant a possible
change in our pricing methods or classification within the fair value hierarchy. Further, we have no investments in auction rate
securities.
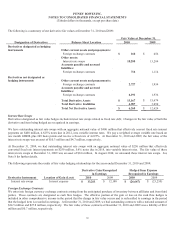
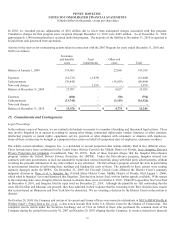
Derivative Instruments
As required by the fair value measurements guidance, we have incorporated counterparty credit risk and our credit risk into the fair
value measurement of our derivative assets and liabilities, respectively. We derive credit risk from observable data related to credit
default swaps. We have not seen a material change in the creditworthiness of those banks acting as derivative counterparties.
The valuation of our interest rate swaps is based on the income approach using a model with inputs that are observable or that can be
derived from or corroborated by observable market data. The valuation of our foreign exchange derivatives are based on the market
approach using observable market inputs, such as forward rates.