Pitney Bowes 2010 Annual Report Download - page 40
Download and view the complete annual report
Please find page 40 of the 2010 Pitney Bowes annual report below. You can navigate through the pages in the report by either clicking on the pages listed below, or by using the keyword search tool below to find specific information within the annual report.-
 1
1 -
2
-
3
-
4
-
5
-
6
-
7
-
8
-
9
-
10
-
11
-
12
-
13
-
14
-
15
-
16
-
17
-
18
-
19
-
20
-
21
-
22
-
23
-
24
-
25
-
26
-
27
-
28
-
29
-
 30
30 -
 31
31 -
 32
32 -
 33
33 -
 34
34 -
 35
35 -
 36
36 -
 37
37 -
 38
38 -
 39
39 -
 40
40 -
 41
41 -
 42
42 -
 43
43 -
 44
44 -
 45
45 -
 46
46 -
 47
47 -
 48
48 -
 49
49 -
 50
50 -
51
-
52
-
53
-
54
-
55
-
56
-
57
-
58
-
59
-
60
-
61
-
62
-
63
-
64
-
65
-
66
-
67
-
68
-
69
-
70
-
71
-
72
-
73
-
74
-
75
-
76
-
77
-
78
-
79
-
80
-
81
-
82
-
83
-
84
-
85
-
86
-
87
-
88
-
89
-
90
-
91
-
92
-
93
-
94
-
95
-
96
-
97
-
98
-
99
-
100
-
101
-
102
-
103
-
104
-
105
-
106
-
107
-
108
-
109
-
110
-
111
-
112
-
113
-
114
-
115
-
116
-
117
-
118
-
119
-
120
-
121
-
122
-
123
-
124
-
125
-
126
 |
 |

21
LIQUIDITY AND CAPITAL RESOURCES
We believe that cash flow from operations, existing cash and liquid investments, as well as borrowing capacity under our commercial
paper program, the existing credit facility and debt capital markets should be sufficient to finance our capital requirements and to
cover our customer deposits. Our potential uses of cash include, but are not limited to, growth and expansion opportunities; internal
investments; customer financing; severance and benefits payments under our restructuring programs; income tax, interest and dividend
payments; pension and other benefit plan funding; acquisitions; and share repurchases.
We continuously review our liquidity profile. We monitor for material changes in the creditworthiness of those banks acting as
derivative counterparties, depository banks or credit providers to us through credit ratings and the credit default swap market. We
have determined that there has not been a material variation in the underlying sources of cash flows currently used to finance the
operations of the company. To date, we have had consistent access to the commercial paper market.
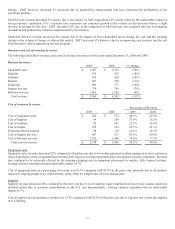
Cash Flow Summary
The change in cash and cash equivalents is as follows:
2010 2009
Net cash provided by operating activities $ 952 $ 824
Net cash used in investing activities (301) (172)
Net cash used in financing activities (580) (626)
Effect of exchange rate changes on cash 1 10
Increase in cash and cash equivalents $ 72 $ 36
2010 Cash Flows
Net cash provided by operating activities consists primarily of net income adjusted for non-cash items and changes in operating assets
and liabilities. Cash provided by operating activities included decreases in finance receivables and accounts receivables of $180
million and $43 million, respectively. Due to declining equipment sales, finance receivables have declined as strong cash collections
exceed the financing of new business. Similarly, accounts receivables have declined primarily due to strong cash collections in excess
of new billings. Cash flow also benefited from the proceeds of $32 million from the unwinding of interest rate swaps and by $59
million due to the timing of payments of accounts payable, accrued liabilities and income taxes. Partially offsetting these benefits
were restructuring payments of $120 million and an increase in inventory of $12 million.
Net cash used in investing activities consisted primarily of the net purchase of investment securities of $122 million, capital
expenditures of $120 million and acquisitions of $78 million.
Net cash used in financing activities primarily included net payments on commercial paper borrowings of $171 million, stock
repurchases of $100 million and dividends paid to common stockholders and noncontrolling interests of $321 million.
2009 Cash Flows
Cash flow provided by operations for 2009 is primarily due to the decrease in finance receivables and accounts receivables of $207
million and $84 million, respectively, primarily due to lower sales volumes, and an increase in current and non-current income taxes
of $86 million due to the timing of tax payments. These cash inflows were partially offset by a reduction in accounts payable and
accrued liabilities of $127 million, primarily due to timing of payments, voluntary pension plan contributions of $125 million and
restructuring payments of $105 million.
Net cash used in investing activities consisted primarily of capital expenditures of $167 million.
Net cash used in financing activities consisted primarily of dividends paid to common stockholders and noncontrolling interests of
$317 million, a net reduction in debt of $242 million, and a net cash outflow associated with the issuance and redemption of preferred
stock issued by a subsidiary of $79 million.
Capital Expenditures
Capital expenditures in 2010 and 2009 included additions to property, plant and equipment of $61 million and $85 million;
respectively, and additions to rental equipment and related inventories of $59 million and $82 million, respectively. The decrease in
capital expenditures is due to lower new meter investments and control over capital spending.