Pitney Bowes 2010 Annual Report Download - page 108
Download and view the complete annual report
Please find page 108 of the 2010 Pitney Bowes annual report below. You can navigate through the pages in the report by either clicking on the pages listed below, or by using the keyword search tool below to find specific information within the annual report.-
 1
1 -
2
-
3
-
4
-
5
-
6
-
7
-
8
-
9
-
10
-
11
-
12
-
13
-
14
-
15
-
16
-
17
-
18
-
19
-
20
-
21
-
22
-
23
-
24
-
25
-
26
-
27
-
28
-
29
-
30
-
31
-
32
-
33
-
34
-
35
-
36
-
37
-
38
-
39
-
40
-
41
-
42
-
43
-
44
-
45
-
46
-
47
-
48
-
49
-
50
-
51
-
52
-
53
-
54
-
55
-
56
-
57
-
58
-
59
-
60
-
61
-
62
-
63
-
64
-
65
-
66
-
67
-
68
-
69
-
70
-
71
-
72
-
73
-
74
-
75
-
76
-
77
-
78
-
79
-
80
-
81
-
82
-
83
-
84
-
85
-
86
-
87
-
88
-
89
-
90
-
91
-
92
-
93
-
94
-
95
-
96
-
97
-
 98
98 -
 99
99 -
 100
100 -
 101
101 -
 102
102 -
 103
103 -
 104
104 -
 105
105 -
 106
106 -
 107
107 -
 108
108 -
 109
109 -
 110
110 -
 111
111 -
 112
112 -
 113
113 -
 114
114 -
 115
115 -
 116
116 -
 117
117 -
 118
118 -
119
-
120
-
121
-
122
-
123
-
124
-
125
-
126
 |
 |

PITNEY BOWES INC.
NOTES TO CONSOLIDATED FINANCIAL STATEMENTS
(Tabular dollars in thousands, except per share data)
89
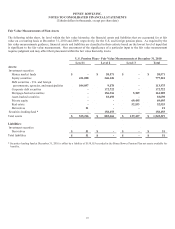
Level 3 Gains and Losses
The following table shows a summary of the changes in the fair value of Level 3 assets of the U.S. pension plans for the year ended
December 31, 2010:
MBS
Private
equity Real estate Total
Balance at December 31, 2009 $ 761 $ 49,231 $ 50,331 $ 100,323
Realized gains / (losses) 1 - 378 379
Unrealized gains / (losses) (139) 5,652 2,374 7,887
Purchases, sales, issuances and
settlements (net) 4,766 14,612 (530) 18,848
Balance at December 31, 2010 $ 5,389 $ 69,495 $ 52,553 $ 127,437
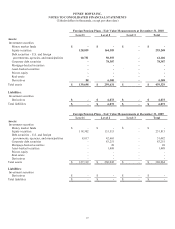
Reconciliation of Plan Assets to Fair Value Measurements Hierarchy
The following table provides a reconciliation of the total fair value of pension plan assets to the fair value of financial instruments
presented in the fair value measurements hierarchy for the U.S. and foreign pension plans at December 31, 2010:
United States Foreign
Fair Value of Plan Assets $ 1,385,174 $ 450,683
Cash (675) (15,185)
Securities lending fund liability 158,155 -
Receivables / Prepaid benefits (24,041) -
Payables / Accrued expenses 26,636 -
Other 19 (3,042)
Fair Value Per Measurements Hierarchy $ 1,545,268 $ 432,456
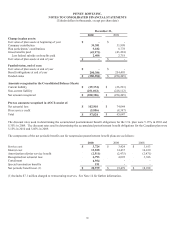
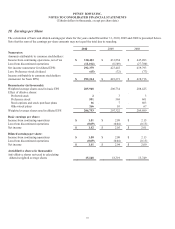
Nonpension Postretirement Benefits
We provide certain health care and life insurance benefits to eligible retirees and their dependents. The cost of these benefits is
recognized over the period the employee provides credited services to the Company. Substantially all of our U.S. and Canadian
employees become eligible for retiree health care benefits after reaching age 55 or in the case of employees of Pitney Bowes
Management Services after reaching age 60 and with the completion of the required service period. U.S. employees hired after
January 1, 2005, and Canadian employees hired after April 1, 2005, are not eligible for retiree health care benefits.
The change in benefit obligation, plan assets and the funded status for nonpension postretirement benefit plans are as follows:
December 31,
2010 2009
Change in benefit obligation:
Benefit obligations at beginning of year $ 254,405 $ 244,544
Service cost 3,724 3,424
Interest cost 13,828 14,437
Plan participants’ contributions 9,182 8,778
Actuarial loss 33,983 21,489
Foreign currency changes 1,061 2,509
Gross benefits paid (45,971) (43,494)
Less federal subsidy on benefits paid 2,408 2,718
Curtailment 7,575 -
Special termination benefits 191 -
Benefit obligations at end of year $ 280,386 $ 254,405