Pitney Bowes 2010 Annual Report Download - page 109
Download and view the complete annual report
Please find page 109 of the 2010 Pitney Bowes annual report below. You can navigate through the pages in the report by either clicking on the pages listed below, or by using the keyword search tool below to find specific information within the annual report.-
 1
1 -
2
-
3
-
4
-
5
-
6
-
7
-
8
-
9
-
10
-
11
-
12
-
13
-
14
-
15
-
16
-
17
-
18
-
19
-
20
-
21
-
22
-
23
-
24
-
25
-
26
-
27
-
28
-
29
-
30
-
31
-
32
-
33
-
34
-
35
-
36
-
37
-
38
-
39
-
40
-
41
-
42
-
43
-
44
-
45
-
46
-
47
-
48
-
49
-
50
-
51
-
52
-
53
-
54
-
55
-
56
-
57
-
58
-
59
-
60
-
61
-
62
-
63
-
64
-
65
-
66
-
67
-
68
-
69
-
70
-
71
-
72
-
73
-
74
-
75
-
76
-
77
-
78
-
79
-
80
-
81
-
82
-
83
-
84
-
85
-
86
-
87
-
88
-
89
-
90
-
91
-
92
-
93
-
94
-
95
-
96
-
97
-
98
-
 99
99 -
 100
100 -
 101
101 -
 102
102 -
 103
103 -
 104
104 -
 105
105 -
 106
106 -
 107
107 -
 108
108 -
 109
109 -
 110
110 -
 111
111 -
 112
112 -
 113
113 -
 114
114 -
 115
115 -
 116
116 -
 117
117 -
 118
118 -
 119
119 -
120
-
121
-
122
-
123
-
124
-
125
-
126
 |
 |

PITNEY BOWES INC.
NOTES TO CONSOLIDATED FINANCIAL STATEMENTS
(Tabular dollars in thousands, except per share data)
90
December 31,
2010 2009
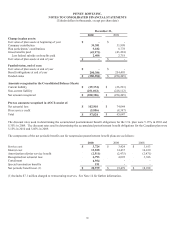
Change in plan assets:
Fair value of plan assets at beginning of year $ - $ -
Company contribution 34,381 31,998
Plan participants’ contributions 9,182 8,778
Gross benefits paid (45,971) (43,494)
Less federal subsidy on benefits paid 2,408 2,718
Fair value of plan assets at end of year $ - $ -
Funded status, end of year:
Fair value of plan assets at end of year $ - $ -
Benefit obligations at end of year 280,386 254,405
Funded status $ (280,386) $ (254,405)
Amounts recognized in the Consolidated Balance Sheets:
Current liability $ (29,374) $ (26,293)
Non-current liability (251,012) (228,112)
Net amount recognized $ (280,386) $ (254,405)
Pre-tax amounts recognized in AOCI consist of:
Net actuarial loss $ 102,910 $ 74,044
Prior service credit (5,886) (8,397)
Total $ 97,024 $ 65,647
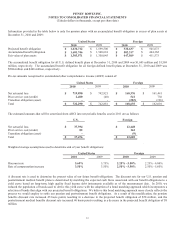
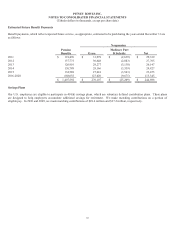
The discount rates used in determining the accumulated postretirement benefit obligations for the U.S. plan were 5.15% in 2010 and
5.35% in 2009. The discount rates used in determining the accumulated postretirement benefit obligations for the Canadian plan were
5.15% in 2010 and 5.85% in 2009.
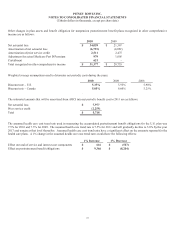
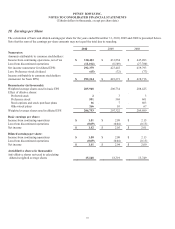
The components of the net periodic benefit cost for nonpension postretirement benefit plans are as follows:
2010 2009 2008
Service cost $ 3,724 $ 3,424 $ 3,613
Interest cost 13,828 14,437 14,410
Amortization of prior service benefit (2,511) (2,475) (2,471)
Recognized net actuarial loss 6,793 4,092 3,386
Curtailment 6,954 - -
Special termination benefits 191 - -
Net periodic benefit cost (1) $ 28,979 $ 19,478 $ 18,938
(1) Includes $7.1 million charged to restructuring reserves. See Note 14 for further information.