Pitney Bowes 2010 Annual Report Download - page 92
Download and view the complete annual report
Please find page 92 of the 2010 Pitney Bowes annual report below. You can navigate through the pages in the report by either clicking on the pages listed below, or by using the keyword search tool below to find specific information within the annual report.-
 1
1 -
2
-
3
-
4
-
5
-
6
-
7
-
8
-
9
-
10
-
11
-
12
-
13
-
14
-
15
-
16
-
17
-
18
-
19
-
20
-
21
-
22
-
23
-
24
-
25
-
26
-
27
-
28
-
29
-
30
-
31
-
32
-
33
-
34
-
35
-
36
-
37
-
38
-
39
-
40
-
41
-
42
-
43
-
44
-
45
-
46
-
47
-
48
-
49
-
50
-
51
-
52
-
53
-
54
-
55
-
56
-
57
-
58
-
59
-
60
-
61
-
62
-
63
-
64
-
65
-
66
-
67
-
68
-
69
-
70
-
71
-
72
-
73
-
74
-
75
-
76
-
77
-
78
-
79
-
80
-
81
-
 82
82 -
 83
83 -
 84
84 -
 85
85 -
 86
86 -
 87
87 -
 88
88 -
 89
89 -
 90
90 -
 91
91 -
 92
92 -
 93
93 -
 94
94 -
 95
95 -
 96
96 -
 97
97 -
 98
98 -
 99
99 -
 100
100 -
 101
101 -
 102
102 -
103
-
104
-
105
-
106
-
107
-
108
-
109
-
110
-
111
-
112
-
113
-
114
-
115
-
116
-
117
-
118
-
119
-
120
-
121
-
122
-
123
-
124
-
125
-
126
 |
 |

PITNEY BOWES INC.
NOTES TO CONSOLIDATED FINANCIAL STATEMENTS
(Tabular dollars in thousands, except per share data)
73
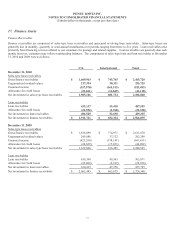
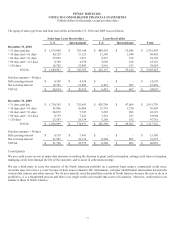
The aging of sales-type lease and loan receivables at December 31, 2010 and 2009 was as follows:
Sales-type Lease Receivables Loan Receivables
U.S. International U.S. International Total
December 31, 2010
< 31 days past due $ 1,575,968 $ 703,146 $ 409,583 $ 52,848 $ 2,741,545
> 30 days and < 61 days 40,129 15,123 11,586 1,644 68,482
> 60 days and < 91 days 27,052 7,071 4,517 519 39,159
> 90 days and < 121 days 8,109 4,530 2,650 254 15,543
> 120 days 18,705 15,895 3,801 153 38,554
TOTAL $ 1,669,963 $ 745,765 $ 432,137 $ 55,418 $ 2,903,283
Past due amounts > 90 days
Still accruing interest $ 8,109 $ 4,530 $ - $ - $ 12,639
Not accruing interest 18,705 15,895 6,451 407 41,458
TOTAL $ 26,814 $ 20,425 $ 6,451 $ 407 $ 54,097
December 31, 2009
< 31 days past due $ 1,730,355 $ 725,643 $ 428,769 $ 47,009 $ 2,931,776
> 30 days and < 61 days 45,946 16,006 13,783 1,254 76,989
> 60 days and < 91 days 28,872 7,547 5,207 495 42,121
> 90 days and < 121 days 8,139 7,441 3,261 253 19,094
> 120 days 23,587 18,334 5,288 552 47,761
TOTAL $ 1,836,899 $ 774,971 $ 456,308 $ 49,563 $ 3,117,741
Past due amounts > 90 days
Still accruing interest $ 8,139 $ 7,441 $ - $ - $ 15,580
Not accruing interest 23,587 18,334 8,549 805 51,275
TOTAL $ 31,726 $ 25,775 $ 8,549 $ 805 $ 66,855
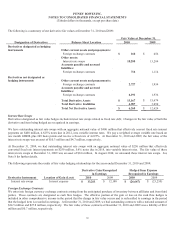
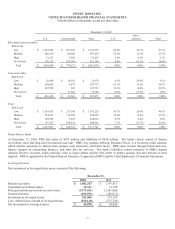
Credit Quality
We use credit scores as one of many data elements in making the decision to grant credit at inception, setting credit lines at inception,
managing credit lines through the life of the customer, and to assist in collections strategy.
We use a third party to score the majority of the North American portfolio on a quarterly basis using a commercial credit score.
Accounts may not receive a score because of data issues related to SIC information, customer identification mismatches between the
various data sources and other reasons. We do not currently score the portfolios outside of North America because the cost to do so is
prohibitive, it is a fragmented process and there is no single credit score model that covers all countries. However, credit policies are
similar to those in North America.