Pitney Bowes 2010 Annual Report Download - page 44
Download and view the complete annual report
Please find page 44 of the 2010 Pitney Bowes annual report below. You can navigate through the pages in the report by either clicking on the pages listed below, or by using the keyword search tool below to find specific information within the annual report.
25
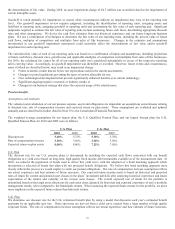
the determination of fair value. During 2010, an asset impairment charge of $4.7 million was recorded related to the impairment of
certain intangible assets.
Goodwill is tested annually for impairment, or sooner when circumstances indicate an impairment may exist at the reporting unit
level. Our goodwill impairment review requires judgment, including the identification of reporting units, assigning assets and
liabilities to reporting units, assigning goodwill to reporting units and determining the fair value of each reporting unit. Significant
judgments required to estimate the fair value of reporting units include estimating future cash flows, determining appropriate discount
rates and other assumptions. We derive the cash flow estimates from our historical experience and our future long-term business
plans. We use a combination of techniques to determine the fair value of our reporting units, including the present value of future
cash flows, multiples of competitors and multiples from sales of like businesses. Changes in the estimates and assumptions
incorporated in our goodwill impairment assessment could materially affect the determination of fair value and/or goodwill
impairment for each reporting unit.
The calculated fair value of each of our reporting units was based on a combination of inputs and assumptions, including projections
of future cash flows, discount rates, growth rates and applicable multiples of competitors and multiples from sales of like businesses.
For 2010, the calculated fair values for all of our reporting units were considered substantially in excess of the respective reporting
unit’s carrying value. Accordingly, no goodwill impairment was identified or recorded. However, future events and circumstances,
some of which are described below, may result in an impairment charge:
• Future economic results that are below our expectations used in the current assessments;
• Changes in postal regulations governing the types of meters allowable for use;
• New technological developments that provide significantly enhanced benefits over current technology;
• Significant ongoing negative economic or industry trends; or
• Changes in our business strategy that alters the expected usage of the related assets.
Pension benefits
Assumptions and estimates
The valuation and calculation of our net pension expense, assets and obligations are dependent on assumptions and estimates relating
to discount rate, rate of compensation increase and expected return on plan assets. These assumptions are evaluated and updated
annually and are described in further detail in Note 19 to the Consolidated Financial Statements.
The weighted average assumptions for our largest plan, the U.S. Qualified Pension Plan, and our largest foreign plan, the U.K.
Qualified Pension Plan, for 2010 and 2009 were as follows:
U.S. Plan U.K. Plan
2010 2009 2010 2009
Discount rate 5.60% 5.75% 5.30% 5.70%
Rate of compensation increase 3.50% 3.50% 3.50% 3.50%
Expected return on plan assets 8.00% 8.00% 7.25% 7.50%
U.S. Plan
The discount rate for our U.S. pension plans is determined by matching the expected cash flows associated with our benefit
obligations to a yield curve based on long-term, high quality fixed income debt instruments available as of the measurement date. In
2010, we reduced the population of bonds used to derive this yield curve with the adoption of a bond matching approach which
incorporates a selection of bonds that align with our projected benefit obligations. We believe this bond matching approach more
closely reflects the process we would employ to settle our pension obligations. The rate of compensation increase assumption reflects
our actual experience and best estimate of future increases. Our expected return on plan assets is based on historical and projected
rates of return for current and planned asset classes in the plans’ investment portfolio after analyzing historical experience and future
expectations of the returns and volatility of the various asset classes. The overall expected rate of return for the portfolio is
determined based on the target asset allocations for each asset class, adjusted for historical and expected experience of active portfolio
management results, when compared to the benchmark returns. When assessing the expected future returns for the portfolio, we place
more emphasis on the expected future returns than historical returns.
U.K. Plan
We determine our discount rate for the U.K. retirement benefit plan by using a model that discounts each year’s estimated benefit
payments by an applicable spot rate. These spot rates are derived from a yield curve created from a large number of high quality
corporate bonds. The rate of compensation increase assumption reflects our actual experience and best estimate of future increases.


