Pitney Bowes 2010 Annual Report Download - page 78
Download and view the complete annual report
Please find page 78 of the 2010 Pitney Bowes annual report below. You can navigate through the pages in the report by either clicking on the pages listed below, or by using the keyword search tool below to find specific information within the annual report.-
 1
1 -
2
-
3
-
4
-
5
-
6
-
7
-
8
-
9
-
10
-
11
-
12
-
13
-
14
-
15
-
16
-
17
-
18
-
19
-
20
-
21
-
22
-
23
-
24
-
25
-
26
-
27
-
28
-
29
-
30
-
31
-
32
-
33
-
34
-
35
-
36
-
37
-
38
-
39
-
40
-
41
-
42
-
43
-
44
-
45
-
46
-
47
-
48
-
49
-
50
-
51
-
52
-
53
-
54
-
55
-
56
-
57
-
58
-
59
-
60
-
61
-
62
-
63
-
64
-
65
-
66
-
67
-
 68
68 -
 69
69 -
 70
70 -
 71
71 -
 72
72 -
 73
73 -
 74
74 -
 75
75 -
 76
76 -
 77
77 -
 78
78 -
 79
79 -
 80
80 -
 81
81 -
 82
82 -
 83
83 -
 84
84 -
 85
85 -
 86
86 -
 87
87 -
 88
88 -
89
-
90
-
91
-
92
-
93
-
94
-
95
-
96
-
97
-
98
-
99
-
100
-
101
-
102
-
103
-
104
-
105
-
106
-
107
-
108
-
109
-
110
-
111
-
112
-
113
-
114
-
115
-
116
-
117
-
118
-
119
-
120
-
121
-
122
-
123
-
124
-
125
-
126
 |
 |

PITNEY BOWES INC.
NOTES TO CONSOLIDATED FINANCIAL STATEMENTS
(Tabular dollars in thousands, except per share data)
59
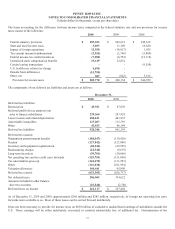
Accumulated Other Comprehensive Loss
The components of accumulated other comprehensive loss are as follow:
2010 2009 2008
Foreign currency translation adjustments $ 137,521 $ 153,206 $ 33,386
Net unrealized loss on derivatives (10,445) (11,738) (18,952)
Net unrealized gain on investment securities 1,439 649 932
Amortization of pension and postretirement costs 81,887 53,589 36,261
Net unamortized loss on pension and postretirement plans (684,208) (655,498) (650,382)
Accumulated other comprehensive loss $ (473,806) $ (459,792) $ (598,755)
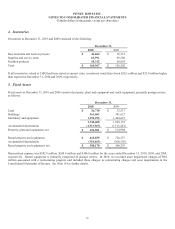
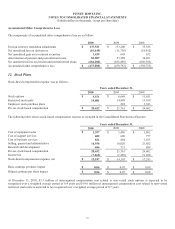
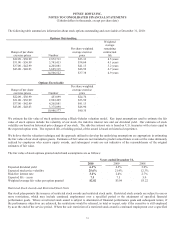
12. Stock Plans
Stock-based compensation expense was as follows:
Years ended December 31,
2010 2009 2008
Stock options $ 5,371 $ 6,649 $ 11,851
Restricted stock units 15,081 14,888 11,168
Employee stock purchase plans - 224 3,383
Pre-tax stock-based compensation $ 20,452 $ 21,761 $ 26,402
The following table shows stock-based compensation expense as included in the Consolidated Statements of Income:
Years ended December 31,
2010 2009 2008
Cost of equipment sales $ 1,397 $ 1,486 $ 1,802
Cost of support services 602 640 777
Cost of business services 831 884 1,073
Selling, general and administrative 16,936 18,020 21,862
Research and development 686 731 888
Pre-tax stock-based compensation 20,452 21,761 26,402
Income tax (7,265) (7,458) (9,109)
Stock-based compensation expense, net $ 13,187 $ 14,303 $ 17,293
Basic earnings per share impact $ 0.06 $ 0.07 $ 0.08
Diluted earnings per share impact $ 0.06 $ 0.07 $ 0.08
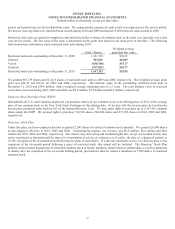
At December 31, 2010, $3.3 million of unrecognized compensation cost related to non-vested stock options is expected to be
recognized over a weighted average period of 0.4 years and $19.6 million of unrecognized compensation cost related to non-vested
restricted stock units is expected to be recognized over a weighted average period of 0.7 years.