Pitney Bowes 2010 Annual Report Download - page 113
Download and view the complete annual report
Please find page 113 of the 2010 Pitney Bowes annual report below. You can navigate through the pages in the report by either clicking on the pages listed below, or by using the keyword search tool below to find specific information within the annual report.-
 1
1 -
2
-
3
-
4
-
5
-
6
-
7
-
8
-
9
-
10
-
11
-
12
-
13
-
14
-
15
-
16
-
17
-
18
-
19
-
20
-
21
-
22
-
23
-
24
-
25
-
26
-
27
-
28
-
29
-
30
-
31
-
32
-
33
-
34
-
35
-
36
-
37
-
38
-
39
-
40
-
41
-
42
-
43
-
44
-
45
-
46
-
47
-
48
-
49
-
50
-
51
-
52
-
53
-
54
-
55
-
56
-
57
-
58
-
59
-
60
-
61
-
62
-
63
-
64
-
65
-
66
-
67
-
68
-
69
-
70
-
71
-
72
-
73
-
74
-
75
-
76
-
77
-
78
-
79
-
80
-
81
-
82
-
83
-
84
-
85
-
86
-
87
-
88
-
89
-
90
-
91
-
92
-
93
-
94
-
95
-
96
-
97
-
98
-
99
-
100
-
101
-
102
-
 103
103 -
 104
104 -
 105
105 -
 106
106 -
 107
107 -
 108
108 -
 109
109 -
 110
110 -
 111
111 -
 112
112 -
 113
113 -
 114
114 -
 115
115 -
 116
116 -
 117
117 -
 118
118 -
 119
119 -
 120
120 -
 121
121 -
 122
122 -
 123
123 -
124
-
125
-
126
 |
 |

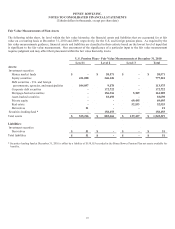
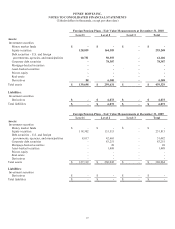
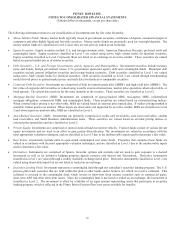
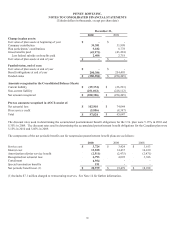
PITNEY BOWES INC.
NOTES TO CONSOLIDATED FINANCIAL STATEMENTS
(Tabular dollars in thousands, except per share data)
94
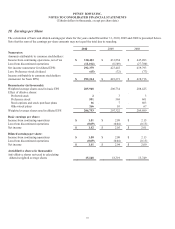
21. Quarterly Financial Data (unaudited)
Summarized quarterly financial data for 2010 and 2009 follows:
2010
First
Quarter
Second
Quarter
Third
Quarter
Fourth
Quarter
Full
Year
Total revenue $ 1,348,233 $ 1,297,237 $ 1,345,742 $ 1,434,042 $ 5,425,254
Gross profit (1) 691,788 645,307 679,412 730,424 2,746,931
Restructuring charges and asset impairments 20,722 48,512 33,805 79,235 182,274
Income from continuing operations 86,763 68,590 96,064 77,390 328,807
Loss from discontinued operations,
net of income tax (3,130) (2,666) (2,536) (9,772) (18,104)
Net income before attribution of
noncontrolling interests 83,633 65,924 93,528 67,618 310,703
Less: Preferred stock dividends of subsidiaries
attributable to noncontrolling interests 4,594 4,543 4,593 4,594 18,324
Net income $ 79,039 $ 61,381 $ 88,935 $ 63,024 $ 292,379
Amounts attributable to common stockholders:
Income from continuing operations $ 82,169 $ 64,047 $ 91,471 $ 72,796 $ 310,483
Loss from discontinued operations (3,130) (2,666) (2,536) (9,772) (18,104)
Net income $ 79,039 $ 61,381 $ 88,935 $ 63,024 $ 292,379
Basic earnings per share attributable to common stockholders (2):
Continuing operations $ 0.40 $ 0.31 $ 0.44 $ 0.36 $ 1.51
Discontinued operations (0.02) (0.01) (0.01) (0.05) (0.09)
Net Income $ 0.38 $ 0.30 $ 0.43 $ 0.31 $ 1.42
Diluted earnings per share attributable to common stockholders (2):
Continuing operations $ 0.40 $ 0.31 $ 0.44 $ 0.36 $ 1.50
Discontinued operations (0.02) (0.01) (0.01) (0.05) (0.09)
Net Income $ 0.38 $ 0.30 $ 0.43 $ 0.31 $ 1.41