Pitney Bowes 2010 Annual Report Download - page 73
Download and view the complete annual report
Please find page 73 of the 2010 Pitney Bowes annual report below. You can navigate through the pages in the report by either clicking on the pages listed below, or by using the keyword search tool below to find specific information within the annual report.-
 1
1 -
2
-
3
-
4
-
5
-
6
-
7
-
8
-
9
-
10
-
11
-
12
-
13
-
14
-
15
-
16
-
17
-
18
-
19
-
20
-
21
-
22
-
23
-
24
-
25
-
26
-
27
-
28
-
29
-
30
-
31
-
32
-
33
-
34
-
35
-
36
-
37
-
38
-
39
-
40
-
41
-
42
-
43
-
44
-
45
-
46
-
47
-
48
-
49
-
50
-
51
-
52
-
53
-
54
-
55
-
56
-
57
-
58
-
59
-
60
-
61
-
62
-
 63
63 -
 64
64 -
 65
65 -
 66
66 -
 67
67 -
 68
68 -
 69
69 -
 70
70 -
 71
71 -
 72
72 -
 73
73 -
 74
74 -
 75
75 -
 76
76 -
 77
77 -
 78
78 -
 79
79 -
 80
80 -
 81
81 -
 82
82 -
 83
83 -
84
-
85
-
86
-
87
-
88
-
89
-
90
-
91
-
92
-
93
-
94
-
95
-
96
-
97
-
98
-
99
-
100
-
101
-
102
-
103
-
104
-
105
-
106
-
107
-
108
-
109
-
110
-
111
-
112
-
113
-
114
-
115
-
116
-
117
-
118
-
119
-
120
-
121
-
122
-
123
-
124
-
125
-
126
 |
 |

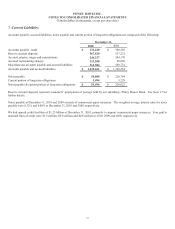
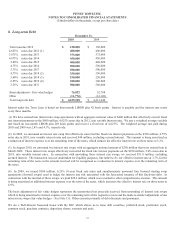
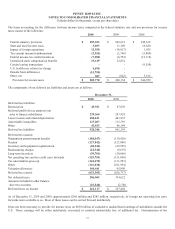
PITNEY BOWES INC.
NOTES TO CONSOLIDATED FINANCIAL STATEMENTS
(Tabular dollars in thousands, except per share data)
54
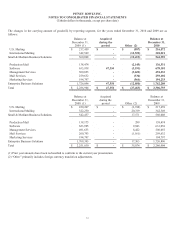
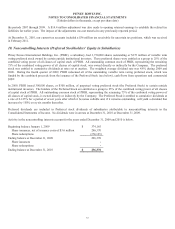
Annual maturities of outstanding long-term debt at December 31, 2010 are as follows: 2011 – $0 million; 2012 – $550 million; 2013 –
$375 million; 2014 – $450 million; 2015 – $400 million; and $2,400 million thereafter.
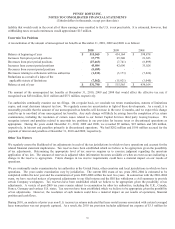
9. Income Taxes
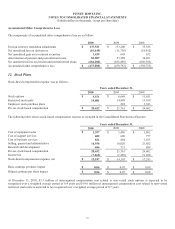
The provision for income taxes from continuing operations consists of the following:
Years ended December 31,
2010 2009 2008
U.S. Federal:
Current $ 170,175 $ 188,272 $ 85,231
Deferred (24,632) 18,979 81,936
145,543 207,251 167,167
U.S. State and Local:
Current 26,523 30,981 17,058
Deferred (17,518) (13,067) 13,434
9,005 17,914 30,492
International:
Current 43,459 31,848 39,974
Deferred 7,763 (16,859) 7,296
51,222 14,989 47,270
Total Current 240,157 251,101 142,263
Total Deferred (34,387) (10,947) 102,666
Total provision for income taxes $ 205,770 $ 240,154 $ 244,929
The components of income from continuing operations are as follows:
Years ended December 31,
2010 2009 2008
U.S. $ 390,911 $ 552,636 $ 573,066
International 143,666 140,540 140,111
Total $ 534,577 $ 693,176 $ 713,177
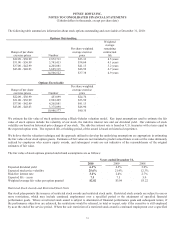
The effective tax rate for continuing operations for 2010, 2009 and 2008 was 38.5%, 34.6% and 34.3%, respectively. The effective
tax rate for 2010 includes $16 million of tax benefits associated with previously unrecognized deferred taxes on outside basis
differences, a $15 million charge for the write-off of deferred tax assets associated with the expiration of out-of-the-money vested
stock options and the vesting of restricted stock units previously granted to our employees and a $9 million charge for the write-off of
deferred tax assets related to the U.S. health care reform legislation that eliminated the tax deduction for retiree health care costs to the
extent of federal subsidies received by companies that provide retiree prescription drug benefits equivalent to Medicare Part D
coverage.
The effective rate for 2009 included a charge of $13 million for the write-off of deferred tax assets associated with the expiration of
out-of-the-money vested stock options and the vesting of restricted stock, offset by $13 million of tax benefits from retirement of
intercompany obligations and the repricing of leveraged lease transactions. The effective tax rate for 2008 included $12 million of tax
increases related to the low tax benefit associated with restructuring expenses recorded during 2008, offset by adjustments of $10
million related to deferred tax assets associated with certain U.S. leasing transactions.