Pitney Bowes 2010 Annual Report Download - page 32
Download and view the complete annual report
Please find page 32 of the 2010 Pitney Bowes annual report below. You can navigate through the pages in the report by either clicking on the pages listed below, or by using the keyword search tool below to find specific information within the annual report.-
 1
1 -
2
-
3
-
4
-
5
-
6
-
7
-
8
-
9
-
10
-
11
-
12
-
13
-
14
-
15
-
16
-
17
-
18
-
19
-
20
-
21
-
 22
22 -
 23
23 -
 24
24 -
 25
25 -
 26
26 -
 27
27 -
 28
28 -
 29
29 -
 30
30 -
 31
31 -
 32
32 -
 33
33 -
 34
34 -
 35
35 -
 36
36 -
 37
37 -
 38
38 -
 39
39 -
 40
40 -
 41
41 -
 42
42 -
43
-
44
-
45
-
46
-
47
-
48
-
49
-
50
-
51
-
52
-
53
-
54
-
55
-
56
-
57
-
58
-
59
-
60
-
61
-
62
-
63
-
64
-
65
-
66
-
67
-
68
-
69
-
70
-
71
-
72
-
73
-
74
-
75
-
76
-
77
-
78
-
79
-
80
-
81
-
82
-
83
-
84
-
85
-
86
-
87
-
88
-
89
-
90
-
91
-
92
-
93
-
94
-
95
-
96
-
97
-
98
-
99
-
100
-
101
-
102
-
103
-
104
-
105
-
106
-
107
-
108
-
109
-
110
-
111
-
112
-
113
-
114
-
115
-
116
-
117
-
118
-
119
-
120
-
121
-
122
-
123
-
124
-
125
-
126
 |
 |

13
RESULTS OF OPERATIONS - 2010 Compared to 2009
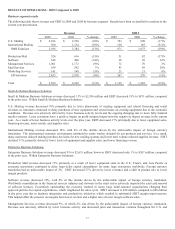
Business segment results
We conduct our business activities in seven reporting segments within two business groups, Small & Medium Business Solutions
(SMB Solutions) and Enterprise Business Solutions (EB Solutions). The following table shows revenue and EBIT in 2010 and 2009
by business segment. EBIT, a non-GAAP measure, is determined by deducting from segment revenue the related costs and expenses
attributable to the segment. EBIT is useful to management in demonstrating the operational profitability of the segments by excluding
interest and taxes, which are generally managed across the entire company on a consolidated basis, and general corporate expenses,
restructuring charges and asset impairments. EBIT is also used for purposes of measuring the performance of our management team.
Refer to Note 18 to the Consolidated Financial Statements for a reconciliation of segment amounts to income from continuing
operations before income taxes.
Revenue EBIT
2010 2009 % change 2010 2009 % change
U.S. Mailing $ 1,879 $ 2,016 (7)% $ 689 $ 743 (7)%
International Mailing 923 920 - % 143 128 12%
SMB Solutions 2,802 2,936 (5)% 832 871 (4)%
Production Mail 557 526 6% 61 51 18%
Software 363 346 5% 42 38 13%
Management Services 999 1,061 (6)% 93 72 28%
Mail Services 562 559 1% 63 83 (23)%
Marketing Services 142 141 - % 26 23 14%
EB Solutions 2,623 2,633 - % 285 267 7%
Total $ 5,425 $ 5,569 (3)% $ 1,117 $ 1,138 (2)%
Small & Medium Business Solutions
Small & Medium Business Solutions revenue decreased 5% to $2,802 million and EBIT decreased 4% to $832 million, compared to
the prior year. Within Small & Medium Business Solutions:
U.S. Mailing revenue decreased 7% to $1,879 million and EBIT decreased 7% to $689 million, compared to the prior year. The
revenue decrease was driven primarily by lower financing, rental, service and supplies revenues. The decrease in financing revenue is
due to a decline in our leasing portfolio from reduced equipment sales in recent years. Rental, supplies and service revenues were
lower than prior year due to fewer placements of new meters. Lease extensions have a positive impact on profit margins longer-term
but negatively impact equipment sales revenue in the current year. Equipment sales and supplies revenue were lower than prior year
due to business consolidations, lease extensions and reduced volumes of mail processed. Revenue was also adversely affected by the
ongoing changing mix to more fully featured smaller systems. The lower EBIT was due to the decline in higher margin financing,
rental and supplies revenues.
International Mailing revenue was flat at $923 million compared to the prior year, including a favorable impact from foreign currency
translation of 2%. While equipment sales were up slightly in certain parts of Europe and Canada, this increase was offset by
continued declines in financing and rental revenues due to reduced equipment sales in recent years. EBIT increased 12% to $143
million compared to prior year, and was favorably impacted by an adjustment related to certain leveraged lease transactions in Canada
(6%), our initiatives to improve productivity and consolidate functions globally and by 4% from foreign currency translation.
Enterprise Business Solutions
Enterprise Business Solutions revenue was flat at $2,623 million and EBIT increased 7% to $285 million, compared to the prior year.
Within Enterprise Business Solutions:
Production Mail revenue increased 6% over the prior year to $557 million due to increased demand in the U.S. for inserting equipment
and our first installations of production print equipment. Demand for inserting equipment continued to experience a delayed recovery
in certain countries outside of North America as many large enterprises in these regions continue to delay capital expenditures due to