Pitney Bowes 2010 Annual Report Download - page 104
Download and view the complete annual report
Please find page 104 of the 2010 Pitney Bowes annual report below. You can navigate through the pages in the report by either clicking on the pages listed below, or by using the keyword search tool below to find specific information within the annual report.-
 1
1 -
2
-
3
-
4
-
5
-
6
-
7
-
8
-
9
-
10
-
11
-
12
-
13
-
14
-
15
-
16
-
17
-
18
-
19
-
20
-
21
-
22
-
23
-
24
-
25
-
26
-
27
-
28
-
29
-
30
-
31
-
32
-
33
-
34
-
35
-
36
-
37
-
38
-
39
-
40
-
41
-
42
-
43
-
44
-
45
-
46
-
47
-
48
-
49
-
50
-
51
-
52
-
53
-
54
-
55
-
56
-
57
-
58
-
59
-
60
-
61
-
62
-
63
-
64
-
65
-
66
-
67
-
68
-
69
-
70
-
71
-
72
-
73
-
74
-
75
-
76
-
77
-
78
-
79
-
80
-
81
-
82
-
83
-
84
-
85
-
86
-
87
-
88
-
89
-
90
-
91
-
92
-
93
-
 94
94 -
 95
95 -
 96
96 -
 97
97 -
 98
98 -
 99
99 -
 100
100 -
 101
101 -
 102
102 -
 103
103 -
 104
104 -
 105
105 -
 106
106 -
 107
107 -
 108
108 -
 109
109 -
 110
110 -
 111
111 -
 112
112 -
 113
113 -
 114
114 -
115
-
116
-
117
-
118
-
119
-
120
-
121
-
122
-
123
-
124
-
125
-
126
 |
 |

PITNEY BOWES INC.
NOTES TO CONSOLIDATED FINANCIAL STATEMENTS
(Tabular dollars in thousands, except per share data)
85
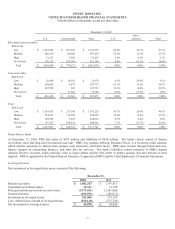
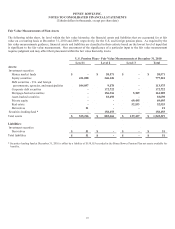
Fair Value Measurements of Plan Assets
The following tables show, by level within the fair value hierarchy, the financial assets and liabilities that are accounted for at fair
value on a recurring basis at December 31, 2010 and 2009, respectively, for the U.S. and foreign pension plans. As required by the
fair value measurements guidance, financial assets and liabilities are classified in their entirety based on the lowest level of input that
is significant to the fair value measurement. Our assessment of the significance of a particular input to the fair value measurement
requires judgment and may affect their placement within the fair value hierarchy levels.
U.S. Pension Plans - Fair Value Measurements at December 31, 2010
Level 1 Level 2 Level 3 Total
Assets:
Investment securities
Money market funds $- $ 20,571 $ - $ 20,571
Equity securities 431,098 346,126 - 777,224
Debt securities - U.S. and foreign
governments, agencies, and municipalities 104,097 9,878 - 113,975
Corporate debt securities - 172,722 - 172,722
Mortgage-backed securities - 156,516 5,389 161,905
Asset-backed securities - 18,698 - 18,698
Private equity - - 69,495 69,495
Real estate - - 52,553 52,553
Derivatives 21 - - 21
Securities lending fund * - 158,155 - 158,155
Total assets $ 535,216 $ 882,666 $ 127,437 $ 1,545,319
Liabilities:
Investment securities
Derivatives $ 51 $ - $ - $ 51
Total liabilities $ 51 $ - $ - $ 51
* Securities lending fund at December 31, 2010 is offset by a liability of $158,155 recorded in the Pitney Bowes Pension Plan net assets available for
benefits.