Pitney Bowes 2010 Annual Report Download - page 57
Download and view the complete annual report
Please find page 57 of the 2010 Pitney Bowes annual report below. You can navigate through the pages in the report by either clicking on the pages listed below, or by using the keyword search tool below to find specific information within the annual report.-
 1
1 -
2
-
3
-
4
-
5
-
6
-
7
-
8
-
9
-
10
-
11
-
12
-
13
-
14
-
15
-
16
-
17
-
18
-
19
-
20
-
21
-
22
-
23
-
24
-
25
-
26
-
27
-
28
-
29
-
30
-
31
-
32
-
33
-
34
-
35
-
36
-
37
-
38
-
39
-
40
-
41
-
42
-
43
-
44
-
45
-
46
-
 47
47 -
 48
48 -
 49
49 -
 50
50 -
 51
51 -
 52
52 -
 53
53 -
 54
54 -
 55
55 -
 56
56 -
 57
57 -
 58
58 -
 59
59 -
 60
60 -
 61
61 -
 62
62 -
 63
63 -
 64
64 -
 65
65 -
 66
66 -
 67
67 -
68
-
69
-
70
-
71
-
72
-
73
-
74
-
75
-
76
-
77
-
78
-
79
-
80
-
81
-
82
-
83
-
84
-
85
-
86
-
87
-
88
-
89
-
90
-
91
-
92
-
93
-
94
-
95
-
96
-
97
-
98
-
99
-
100
-
101
-
102
-
103
-
104
-
105
-
106
-
107
-
108
-
109
-
110
-
111
-
112
-
113
-
114
-
115
-
116
-
117
-
118
-
119
-
120
-
121
-
122
-
123
-
124
-
125
-
126
 |
 |

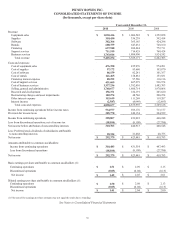
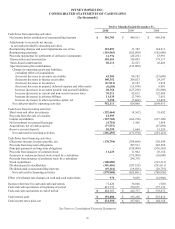
38
PITNEY BOWES INC.
CONSOLIDATED STATEMENTS OF INCOME
(In thousands, except per share data)
Years ended December 31,
2010 2009 2008
Revenue:
Equipment sales $ 1,030,416 $ 1,006,542 $ 1,252,058
Supplies 318,430 336,239 392,414
Software 382,366 365,185 424,296
Rentals 600,759 647,432 728,160
Financing 637,948 694,444 772,711
Support services 711,519 714,429 768,424
Business services 1,743,816 1,804,900 1,924,242
Total revenue 5,425,254 5,569,171 6,262,305
Costs and expenses:
Cost of equipment sales 476,390 455,976 574,201
Cost of supplies 97,172 93,660 103,870
Cost of software 86,159 82,241 101,357
Cost of rentals 141,465 158,881 153,831
Financing interest expense 88,292 97,586 110,136
Cost of support services 451,609 467,279 536,974
Cost of business services 1,337,236 1,382,401 1,485,703
Selling, general and administrative 1,760,677 1,800,714 1,970,868
Research and development 156,371 182,191 205,620
Restructuring charges and asset impairments 182,274 48,746 200,254
Other interest expense 115,619 111,269 119,207
Interest income (2,587) (4,949) (12,893)
Total costs and expenses 4,890,677 4,875,995 5,549,128
Income from continuing operations before income taxes 534,577 693,176 713,177
Provision for income taxes 205,770 240,154 244,929
Income from continuing operations 328,807 453,022 468,248
Loss from discontinued operations, net of income tax (18,104) (8,109) (27,700)
Net income before attribution of noncontrolling interests 310,703 444,913 440,548
Less: Preferred stock dividends of subsidiaries attributable
to noncontrolling interests 18,324 21,468 20,755
Net income $ 292,379 $ 423,445 $ 419,793
Amounts attributable to common stockholders:
Income from continuing operations $ 310,483 $ 431,554 $ 447,493
Loss from discontinued operations (18,104) (8,109) (27,700)
Net income $ 292,379 $ 423,445 $ 419,793
Basic earnings per share attributable to common stockholders (1):
Continuing operations $ 1.51 $ 2.09 $ 2.15
Discontinued operations (0.09) (0.04) (0.13)
Net income $ 1.42 $ 2.05 $ 2.01
Diluted earnings per share attributable to common stockholders (1):
Continuing operations $ 1.50 $ 2.08 $ 2.13
Discontinued operations (0.09) (0.04) (0.13)
Net income $ 1.41 $ 2.04 $ 2.00
(1) The sum of the earnings per share amounts may not equal the totals due to rounding.
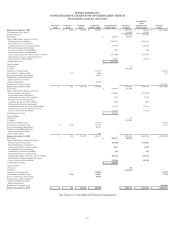
See Notes to Consolidated Financial Statements