Pitney Bowes 2010 Annual Report Download - page 102
Download and view the complete annual report
Please find page 102 of the 2010 Pitney Bowes annual report below. You can navigate through the pages in the report by either clicking on the pages listed below, or by using the keyword search tool below to find specific information within the annual report.-
 1
1 -
2
-
3
-
4
-
5
-
6
-
7
-
8
-
9
-
10
-
11
-
12
-
13
-
14
-
15
-
16
-
17
-
18
-
19
-
20
-
21
-
22
-
23
-
24
-
25
-
26
-
27
-
28
-
29
-
30
-
31
-
32
-
33
-
34
-
35
-
36
-
37
-
38
-
39
-
40
-
41
-
42
-
43
-
44
-
45
-
46
-
47
-
48
-
49
-
50
-
51
-
52
-
53
-
54
-
55
-
56
-
57
-
58
-
59
-
60
-
61
-
62
-
63
-
64
-
65
-
66
-
67
-
68
-
69
-
70
-
71
-
72
-
73
-
74
-
75
-
76
-
77
-
78
-
79
-
80
-
81
-
82
-
83
-
84
-
85
-
86
-
87
-
88
-
89
-
90
-
91
-
 92
92 -
 93
93 -
 94
94 -
 95
95 -
 96
96 -
 97
97 -
 98
98 -
 99
99 -
 100
100 -
 101
101 -
 102
102 -
 103
103 -
 104
104 -
 105
105 -
 106
106 -
 107
107 -
 108
108 -
 109
109 -
 110
110 -
 111
111 -
 112
112 -
113
-
114
-
115
-
116
-
117
-
118
-
119
-
120
-
121
-
122
-
123
-
124
-
125
-
126
 |
 |

PITNEY BOWES INC.
NOTES TO CONSOLIDATED FINANCIAL STATEMENTS
(Tabular dollars in thousands, except per share data)
83
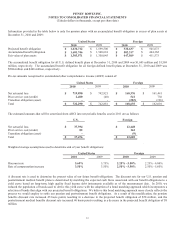
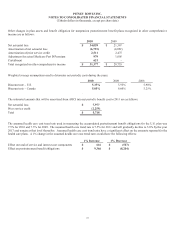
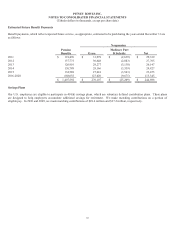
Weighted average assumptions used to determine net periodic benefit costs:
United States Foreign
2010 2009 2008 2010 2009 2008
Discount rate 5.75% 6.05% 6.15% 2.25% - 6.00% 2.25% - 6.60% 2.25% - 5.80%
Expected return on
plan assets 8.00% 8.00% 8.50% 4.50% - 7.75% 4.49% - 7.75% 3.50% - 7.75%
Rate of compensation
increase 3.50% 4.25% 4.50% 2.50% - 5.60% 2.50% - 5.10% 2.50% - 5.50%
The expected return on plan assets is based on historical and projected rates of return for current and planned asset classes in the
plans’ investment portfolio after analyzing historical experience and future expectations of the returns and volatility of the various
asset classes. The overall expected rate of return for the portfolio was determined based on the target asset allocations for each asset
class, adjusted for historical and expected experience of active portfolio management results, when compared to the benchmark
returns. When assessing the expected future returns for the portfolio, management placed more emphasis on the expected future
returns than historical returns.
U.S. Pension Plans’ Investment Strategy and Asset Allocation
Our U.S. pension plans’ investment strategy is to maximize returns within reasonable and prudent levels of risk, to achieve and
maintain full funding of the accumulated benefit obligations and the actuarial liabilities, and to earn a nominal rate of return of at least
8%. The fund has established a strategic asset allocation policy to achieve these objectives. Investments are diversified across asset
classes and within each class to reduce the risk of large losses and are periodically rebalanced. Derivatives, such as swaps, options,
forwards and futures contracts may be used for market exposure, to alter risk/return characteristics and to manage foreign currency
exposure. Investments within the private equity and real estate portfolios are comprised of limited partnership units in primary and
secondary fund of funds and units in open-ended commingled real estate funds, respectively. These types of investment vehicles are
used in an effort to gain greater asset diversification. We have no hedge fund investments. We do not have any significant
concentrations of credit risk within the plan assets. The pension plans’ liabilities, investment objectives and investment managers are
reviewed periodically.
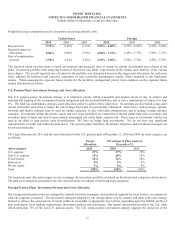
The target allocation for 2011 and the asset allocation for the U.S. pension plan at December 31, 2010 and 2009, by asset category, are
as follows:
Target
Allocation
Percentage of Plan Assets at
December 31,
Asset category 2011 2010 2009
U.S. equities 37% 37% 35%
Non-U.S. equities 19% 20% 19%
Fixed income 32% 34% 38%
Real estate 5% 4% 4%
Private equity 7% 5% 4%
Total 100% 100% 100%
The long-term asset allocation targets we use to manage the investment portfolio are based on the broad asset categories shown above.
The plan asset categories presented in the fair value hierarchy are subsets of the broad asset categories.
Foreign Pension Plans’ Investment Strategy and Asset Allocation
Our foreign pension plan assets are managed by outside investment managers and monitored regularly by local trustees, in conjunction
with our corporate personnel. The investment strategies adopted by our foreign plans vary by country and plan, with each strategy
tailored to achieve the expected rate of return within an acceptable or appropriate level of risk, depending upon the liability profile of
plan participants, local funding requirements, investment markets and restrictions. Our largest foreign pension plan is the U.K. plan,
which represents 75% of the non-U.S. pension assets. The U.K. pension plan’s investment strategy supports the objectives of the