Pitney Bowes 2010 Annual Report Download - page 35
Download and view the complete annual report
Please find page 35 of the 2010 Pitney Bowes annual report below. You can navigate through the pages in the report by either clicking on the pages listed below, or by using the keyword search tool below to find specific information within the annual report.-
 1
1 -
2
-
3
-
4
-
5
-
6
-
7
-
8
-
9
-
10
-
11
-
12
-
13
-
14
-
15
-
16
-
17
-
18
-
19
-
20
-
21
-
22
-
23
-
24
-
 25
25 -
 26
26 -
 27
27 -
 28
28 -
 29
29 -
 30
30 -
 31
31 -
 32
32 -
 33
33 -
 34
34 -
 35
35 -
 36
36 -
 37
37 -
 38
38 -
 39
39 -
 40
40 -
 41
41 -
 42
42 -
 43
43 -
 44
44 -
 45
45 -
46
-
47
-
48
-
49
-
50
-
51
-
52
-
53
-
54
-
55
-
56
-
57
-
58
-
59
-
60
-
61
-
62
-
63
-
64
-
65
-
66
-
67
-
68
-
69
-
70
-
71
-
72
-
73
-
74
-
75
-
76
-
77
-
78
-
79
-
80
-
81
-
82
-
83
-
84
-
85
-
86
-
87
-
88
-
89
-
90
-
91
-
92
-
93
-
94
-
95
-
96
-
97
-
98
-
99
-
100
-
101
-
102
-
103
-
104
-
105
-
106
-
107
-
108
-
109
-
110
-
111
-
112
-
113
-
114
-
115
-
116
-
117
-
118
-
119
-
120
-
121
-
122
-
123
-
124
-
125
-
126
 |
 |
16
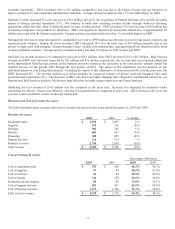
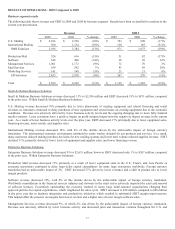
Selling, general and administrative (SG&A)
SG&A expenses decreased $40 million, or 2% primarily as a result of our cost reduction initiatives. Businesses acquired in 2010
increased SG&A by $15 million and foreign currency translation had a less than 1% unfavorable impact. As a percentage of revenue,
SG&A expenses were 32.5% compared to 32.3% in the prior year.
Research and development
Research and development expenses decreased $26 million, or 14% from the prior year due to the wind-down of redundant costs
related to our transition to offshore development activities and the launch of the new Connect+TM mailing system. Foreign currency
translation had an unfavorable impact of 1%. As a percentage of revenue, research and development expenses were 2.9% compared to
3.3% in the prior year.
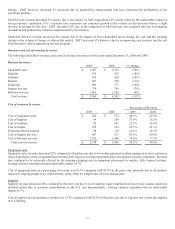
Other interest expense
Other interest expense increased $4 million, or 4% in 2010 compared to the prior year. Included in other interest expense is credit
facility fees which were higher compared to the prior year. We do not allocate other interest expense to our business segments.
Income taxes / effective tax rate
The effective tax rates for 2010 and 2009 were 38.5% and 34.6%, respectively. The effective tax rate for 2010 includes $16 million of
tax benefits associated with previously unrecognized deferred taxes on outside basis differences, a $15 million charge for the write-off
of deferred tax assets associated with the expiration of out-of-the-money vested stock options and the vesting of restricted stock units
previously granted to our employees and a $9 million charge for the write-off of deferred tax assets related to the U.S. health care
reform legislation that eliminated the tax deduction for retiree health care costs to the extent of federal subsidies received by
companies that provide retiree prescription drug benefits equivalent to Medicare Part D coverage.
The effective tax rate for 2009 included $13 million of tax charges related to the write-off of deferred tax assets associated with the
expiration of out-of-the-money vested stock options and the vesting of restricted stock, offset by $13 million of tax benefits from
retirement of inter-company obligations and the repricing of leveraged lease transactions.
Discontinued operations
The loss from discontinued operations in 2010 primarily relates to the accrual of interest on uncertain tax positions and additional tax
associated with the disposed operations. The 2009 net loss from discontinued operations includes $10 million of pre-tax income ($6
million net of tax) for a bankruptcy settlement received and $11 million of pre-tax income ($7 million net of tax) related to the
expiration of an indemnity agreement associated with the sale of a former subsidiary. This income was more than offset by the
accrual of interest on uncertain tax positions. See Note 2 to the Consolidated Financial Statements.
Preferred stock dividends of subsidiaries attributable to noncontrolling interests
Preferred stock dividends to stockholders of subsidiary companies were $18 million and $21 million in 2010 and 2009, respectively.
The 2009 amount included an expense of $3 million associated with the redemption of $375 million of variable term voting preferred
stock. See Note 10 to the Consolidated Financial Statements for further discussion.