Nokia 2005 Annual Report Download - page 78
Download and view the complete annual report
Please find page 78 of the 2005 Nokia annual report below. You can navigate through the pages in the report by either clicking on the pages listed below, or by using the keyword search tool below to find specific information within the annual report.-
 1
1 -
2
-
3
-
4
-
5
-
6
-
7
-
8
-
9
-
10
-
11
-
12
-
13
-
14
-
15
-
16
-
17
-
18
-
19
-
20
-
21
-
22
-
23
-
24
-
25
-
26
-
27
-
28
-
29
-
30
-
31
-
32
-
33
-
34
-
35
-
36
-
37
-
38
-
39
-
40
-
41
-
42
-
43
-
44
-
45
-
46
-
47
-
48
-
49
-
50
-
51
-
52
-
53
-
54
-
55
-
56
-
57
-
58
-
59
-
60
-
61
-
62
-
63
-
64
-
65
-
66
-
67
-
 68
68 -
 69
69 -
 70
70 -
 71
71 -
 72
72 -
 73
73 -
 74
74 -
 75
75 -
 76
76 -
 77
77 -
 78
78 -
 79
79 -
 80
80 -
 81
81 -
 82
82 -
 83
83 -
 84
84 -
 85
85 -
 86
86 -
 87
87 -
 88
88 -
89
-
90
-
91
-
92
-
93
-
94
-
95
-
96
-
97
-
98
-
99
-
100
-
101
-
102
-
103
-
104
-
105
-
106
-
107
-
108
-
109
-
110
-
111
-
112
-
113
-
114
-
115
-
116
-
117
-
118
-
119
-
120
-
121
-
122
-
123
-
124
-
125
-
126
-
127
-
128
-
129
-
130
-
131
-
132
-
133
-
134
-
135
-
136
-
137
-
138
-
139
-
140
-
141
-
142
-
143
-
144
-
145
-
146
-
147
-
148
-
149
-
150
-
151
-
152
-
153
-
154
-
155
-
156
-
157
-
158
-
159
-
160
-
161
-
162
-
163
-
164
-
165
-
166
-
167
-
168
-
169
-
170
-
171
-
172
-
173
-
174
-
175
-
176
-
177
-
178
-
179
-
180
-
181
-
182
-
183
-
184
-
185
-
186
-
187
-
188
-
189
-
190
-
191
-
192
-
193
-
194
-
195
-
196
-
197
-
198
-
199
-
200
-
201
-
202
-
203
-
204
-
205
-
206
-
207
-
208
-
209
-
210
-
211
-
212
-
213
-
214
-
215
-
216
-
217
-
218
-
219
-
220
-
221
-
222
-
223
-
224
-
225
-
226
-
227
 |
 |
If the restructuring costs in Multimedia in 2005 (EUR 15 million) and the impairments and
write-offs of capitalized R&D costs and the restructuring costs in Networks were excluded from
both the 2004 (impairments of EUR 115 million) and 2003 (personnel-related restructuring costs,
impairments and write-offs of EUR 470 million), R&D expenses would have increased 4% in 2005
and 10% in 2004. This would have represented 11.1% of Nokia net sales in 2005 compared with
12.5% of Nokia net sales in 2004 and 11.3% of net sales in 2003.
To enable our future growth, we continued to improve the efficiency of our worldwide research
and development network and increased our collaboration with third parties. At December 31,
2005, we employed 20 882 people in research and development, representing approximately 36%
of Nokia’s total workforce. Research and development expenses of Mobile Phones as a percentage
of its net sales were 6.0% in 2005 compared with 6.5% in 2004 and 4.9% in 2003. In Multimedia,
research and development expenses as a percentage of its net sales were 14.4% in 2005 compared
with 23.5% in 2004 and 28.9% in 2003. Research and development expenses of Enterprise
Solutions as a percentage of its net sales were 38.2%, compared with 36.2% in 2004 and 44.3% in
2003. In the case of Networks, research and development costs represented 17.8%, 18.6% and
27.5% of its net sales in 2005, 2004 and 2003, respectively. If the impairments and write-offs of
capitalized R&D costs and restructuring costs described in the previous paragraph were excluded,
the R&D costs of Networks would have represented 17.8%, 16.8% and 19.2% of Networks’ net sales
in 2005, 2004 and 2003, respectively. See ‘‘Item 4.B Business Overview—Technology, Research and
Development’’ and ‘‘—Patents and Licenses.’’
We are reviewing our R&D activities in order to get the most compelling products to market at the
right time, and we are aiming to lower our R&D expenses/net sales ratio while remaining effective
and focused in our efforts. This will require focused R&D spending and a re-engineered product
creation process intended to reduce product development cycle times. Our target is to bring overall
Nokia R&D expenditure down to 9%-10% of net sales by the end of 2006. In accordance with this
plan, we have set as a target that by the end of 2006 the R&D expenses/net sales ratio of our
mobile devices business would be 8% and 14% for our infrastructure business. However, there are
a number of market developments, including an increased requirement for 3G/WCDMA frequency
variants and alternative radio access technologies, that may affect our ability to achieve our 14%
target for our infrastructure business by the end of 2006.
5.D Trends
See ‘‘Item 5.A Operating Results—Overview’’ for information on material trends affecting our
business and results of operations.
5.E Off-Balance Sheet Arrangements
There are no material off-balance sheet arrangements that have or are reasonably likely to have a
current or future effect on our financial condition, changes in financial condition, revenues or
expenses, results of operations, liquidity, capital expenditures or capital resources that is material
to investors.
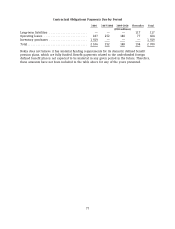
5.F Tabular Disclosure of Contractual Obligations
The following table sets forth our contractual obligations for the periods indicated.
76