Nokia 2005 Annual Report Download - page 47
Download and view the complete annual report
Please find page 47 of the 2005 Nokia annual report below. You can navigate through the pages in the report by either clicking on the pages listed below, or by using the keyword search tool below to find specific information within the annual report.-
 1
1 -
2
-
3
-
4
-
5
-
6
-
7
-
8
-
9
-
10
-
11
-
12
-
13
-
14
-
15
-
16
-
17
-
18
-
19
-
20
-
21
-
22
-
23
-
24
-
25
-
26
-
27
-
28
-
29
-
30
-
31
-
32
-
33
-
34
-
35
-
36
-
 37
37 -
 38
38 -
 39
39 -
 40
40 -
 41
41 -
 42
42 -
 43
43 -
 44
44 -
 45
45 -
 46
46 -
 47
47 -
 48
48 -
 49
49 -
 50
50 -
 51
51 -
 52
52 -
 53
53 -
 54
54 -
 55
55 -
 56
56 -
 57
57 -
58
-
59
-
60
-
61
-
62
-
63
-
64
-
65
-
66
-
67
-
68
-
69
-
70
-
71
-
72
-
73
-
74
-
75
-
76
-
77
-
78
-
79
-
80
-
81
-
82
-
83
-
84
-
85
-
86
-
87
-
88
-
89
-
90
-
91
-
92
-
93
-
94
-
95
-
96
-
97
-
98
-
99
-
100
-
101
-
102
-
103
-
104
-
105
-
106
-
107
-
108
-
109
-
110
-
111
-
112
-
113
-
114
-
115
-
116
-
117
-
118
-
119
-
120
-
121
-
122
-
123
-
124
-
125
-
126
-
127
-
128
-
129
-
130
-
131
-
132
-
133
-
134
-
135
-
136
-
137
-
138
-
139
-
140
-
141
-
142
-
143
-
144
-
145
-
146
-
147
-
148
-
149
-
150
-
151
-
152
-
153
-
154
-
155
-
156
-
157
-
158
-
159
-
160
-
161
-
162
-
163
-
164
-
165
-
166
-
167
-
168
-
169
-
170
-
171
-
172
-
173
-
174
-
175
-
176
-
177
-
178
-
179
-
180
-
181
-
182
-
183
-
184
-
185
-
186
-
187
-
188
-
189
-
190
-
191
-
192
-
193
-
194
-
195
-
196
-
197
-
198
-
199
-
200
-
201
-
202
-
203
-
204
-
205
-
206
-
207
-
208
-
209
-
210
-
211
-
212
-
213
-
214
-
215
-
216
-
217
-
218
-
219
-
220
-
221
-
222
-
223
-
224
-
225
-
226
-
227
 |
 |

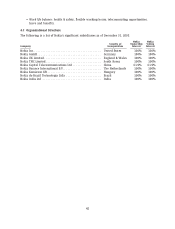
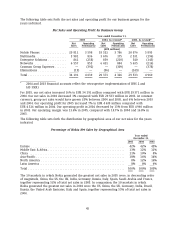
The following table sets forth the net sales and operating profit for our business groups for the
years indicated.
Net Sales and Operating Profit by Business Group
Year ended December 31,
2005 2004, As revised* 2003, As revised*
Net Operating Net Operating Net Operating
Sales Profit/(Loss) Sales Profit/(Loss) Sales Profit/(Loss)
(EUR millions)
Mobile Phones ............... 20 811 3 598 18 521 3 786 20 976 5 893
Multimedia .................. 5 981 836 3 676 175 2 531 (196)
Enterprise Solutions ........... 861 (258) 839 (210) 540 (143)
Networks ................... 6 557 855 6 431 884 5 635 (216)
Common Group Expenses ....... — (392) — (309) — (378)
Eliminations ................. (19) — (96) — (149) —
Total ....................... 34 191 4 639 29 371 4 326 29 533 4 960
*2004 and 2003 financial accounts reflect the retrospective implementation of IFRS 2 and
IAS 39(R).
For 2005, our net sales increased 16% to EUR 34 191 million compared with EUR 29 371 million in
2004. Our net sales in 2004 decreased 1% compared with EUR 29 533 million in 2003. At constant
currency, group net sales would have grown 20% between 2004 and 2005, and 6% between 2003
and 2004. Our operating profit for 2005 increased 7% to EUR 4 639 million compared with
EUR 4 326 million in 2004. Our operating profit in 2004 decreased by 13% from EUR 4 960 million
in 2003. Our operating margin was 13.6% in 2005, compared with 14.7% in 2004 and 16.8% in
2003.
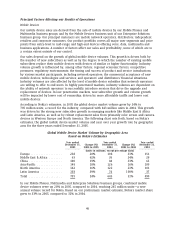
The following table sets forth the distribution by geographical area of our net sales for the years
indicated.
Percentage of Nokia Net Sales by Geographical Area
Year ended
December 31,
2005 2004 2003
Europe ........................................................ 42% 42% 45%
Middle East & Africa .............................................. 13% 12% 11%
China ......................................................... 11% 10% 8%
Asia-Pacific ..................................................... 18% 16% 14%
North America .................................................. 8% 12% 16%
Latin America ................................................... 8% 8% 6%
Total .......................................................... 100% 100% 100%
The 10 markets in which Nokia generated the greatest net sales in 2005 were, in descending order
of magnitude, China, the US, the UK, India, Germany, Russia, Italy, Spain, Saudi Arabia and France,
together representing 52% of total net sales in 2005. In comparison, the 10 markets in which
Nokia generated the greatest net sales in 2004 were the US, China, the UK, Germany, India, Brazil,
Russia, the United Arab Emirates, Italy and Spain, together representing 55% of total net sales in
2004.
45