Nokia 2005 Annual Report Download - page 165
Download and view the complete annual report
Please find page 165 of the 2005 Nokia annual report below. You can navigate through the pages in the report by either clicking on the pages listed below, or by using the keyword search tool below to find specific information within the annual report.-
 1
1 -
2
-
3
-
4
-
5
-
6
-
7
-
8
-
9
-
10
-
11
-
12
-
13
-
14
-
15
-
16
-
17
-
18
-
19
-
20
-
21
-
22
-
23
-
24
-
25
-
26
-
27
-
28
-
29
-
30
-
31
-
32
-
33
-
34
-
35
-
36
-
37
-
38
-
39
-
40
-
41
-
42
-
43
-
44
-
45
-
46
-
47
-
48
-
49
-
50
-
51
-
52
-
53
-
54
-
55
-
56
-
57
-
58
-
59
-
60
-
61
-
62
-
63
-
64
-
65
-
66
-
67
-
68
-
69
-
70
-
71
-
72
-
73
-
74
-
75
-
76
-
77
-
78
-
79
-
80
-
81
-
82
-
83
-
84
-
85
-
86
-
87
-
88
-
89
-
90
-
91
-
92
-
93
-
94
-
95
-
96
-
97
-
98
-
99
-
100
-
101
-
102
-
103
-
104
-
105
-
106
-
107
-
108
-
109
-
110
-
111
-
112
-
113
-
114
-
115
-
116
-
117
-
118
-
119
-
120
-
121
-
122
-
123
-
124
-
125
-
126
-
127
-
128
-
129
-
130
-
131
-
132
-
133
-
134
-
135
-
136
-
137
-
138
-
139
-
140
-
141
-
142
-
143
-
144
-
145
-
146
-
147
-
148
-
149
-
150
-
151
-
152
-
153
-
154
-
 155
155 -
 156
156 -
 157
157 -
 158
158 -
 159
159 -
 160
160 -
 161
161 -
 162
162 -
 163
163 -
 164
164 -
 165
165 -
 166
166 -
 167
167 -
 168
168 -
 169
169 -
 170
170 -
 171
171 -
 172
172 -
 173
173 -
 174
174 -
 175
175 -
176
-
177
-
178
-
179
-
180
-
181
-
182
-
183
-
184
-
185
-
186
-
187
-
188
-
189
-
190
-
191
-
192
-
193
-
194
-
195
-
196
-
197
-
198
-
199
-
200
-
201
-
202
-
203
-
204
-
205
-
206
-
207
-
208
-
209
-
210
-
211
-
212
-
213
-
214
-
215
-
216
-
217
-
218
-
219
-
220
-
221
-
222
-
223
-
224
-
225
-
226
-
227
 |
 |

Notes to the Consolidated Financial Statements (Continued)
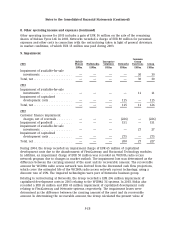
6. Pensions (Continued)
Movements in prepaid pension costs recognized in the balance sheet are as follows:
2005 2004
EURm EURm
Prepaid pension costs at beginning of year .................................. 126 79
Net income (expense) recognized in the profit and loss account ................. (46) (61)
Contributions paid ..................................................... 46 108
Foreign exchange ...................................................... 1—
Prepaid pension costs at end of year ....................................... 127* 126*
*Included within prepaid expenses and accrued income.
The principal actuarial weighted average assumptions used were as follows:
2005 2004
Domestic Foreign Domestic Foreign
%%%%
Discount rate for determining present values ............. 4.20 4.55 4.75 5.00
Expected long-term rate of return on plan assets .......... 4.44 5.49 5.00 5.31
Annual rate of increase in future compensation levels ...... 3.50 3.91 3.50 3.82
Pension increases ................................... 2.00 2.55 2.00 2.38
The prepaid pension cost above is made up of a prepayment of EUR 207 million (EUR 202 million
in 2004) and an accrual of EUR 80 million (EUR 76 million in 2004).
The domestic pension plans’ assets include Nokia securities with fair values of EUR 6 million in
2005 (EUR 4 million in 2004).
The foreign pension plan assets include a self investment through a loan provided to Nokia by the
Group’s German pension fund of EUR 62 million (EUR 62 million in 2004). See Note 34.
The actual return on plan assets was EUR 147 million in 2005 (EUR 83 million in 2004).
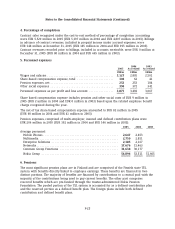
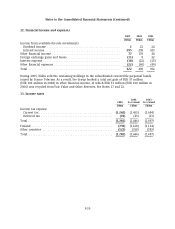
7. Advertising and promotional expenses
The Group expenses advertising and promotion costs as incurred. Advertising and promotional
expenses were EUR 1,481 million in 2005 (EUR 1,144 million in 2004 and EUR 1,414 million
in 2003).
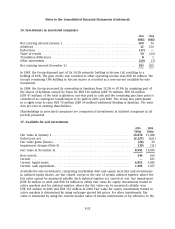
8. Other operating income and expenses
Other operating income for 2005 includes a gain of EUR 61 million relating to the divestiture of
the Group’s Tetra business, a EUR 18 million gain related to the partial sale of a minority
investment (see Note 16) and a EUR 45 million gain related to qualifying sales and leaseback
transactions for real estate. In 2005, Enterprise Solutions recorded a charge of EUR 29 million for
personnel expenses and other costs in connection with a restructuring taken in light of general
downturn in market conditions, which were fully paid during 2005.
Other operating income for 2004 includes a gain of EUR 160 million representing the premium
return under a multi-line, multi-year insurance program, which expired during 2004. The return
was due to our low claims experience during the policy period.
F-27